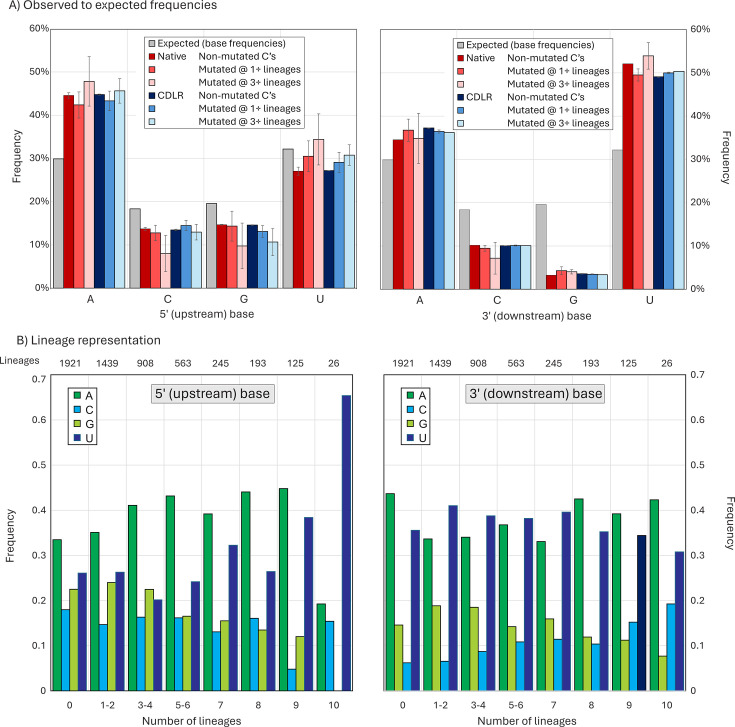
Fig 7.
Observed and expected 5′ and 3′ base context frequencies of C residues in the SARS-CoV-2 genome sequences, either non-mutated or showing C→U mutations. (A) Predicted and observed frequencies of bases 5′ (upstream) and 3′ (downstream) of C’s, split into sites that were invariant or mutated in one or more lineages. Observed frequencies were compared with those of sequences randomized by CDLR that preserved native coding and dinucleotide frequencies. Frequency estimations based on mononucleotide frequencies alone are indicated by gray bars. Error bars for native and CDLR sequences show one standard deviation of values from the four lineages analyzed (Y2020, delta, BA.1, and JN.1). (B) Distribution of 5′ and 3′ bases at C→U mutation sites occurring in different numbers of lineages and at invariant C sites.

