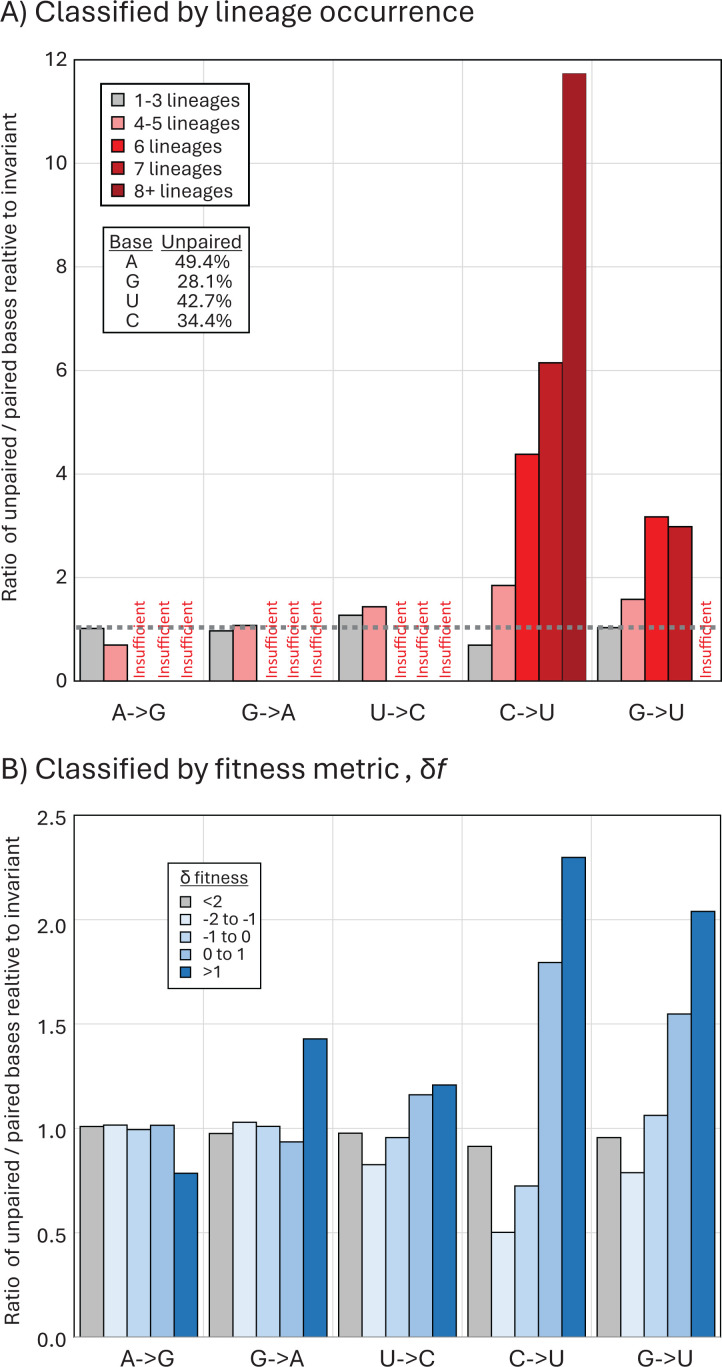
Fig 8.
Transition site associations with RNA secondary structure pairing. (A) Comparison of frequencies of unpaired bases at sites with mutations in one or more lineage (gray bars) and four, six, eight, or more lineages (pink, red, and dark red bars) with those of invariant sites (proportions of unpaired bases shown in inset table). (B) Frequency of unpaired bases at sites classified by the fitness metric, δf (log ratio of observed substitutions/expected number) (31).

