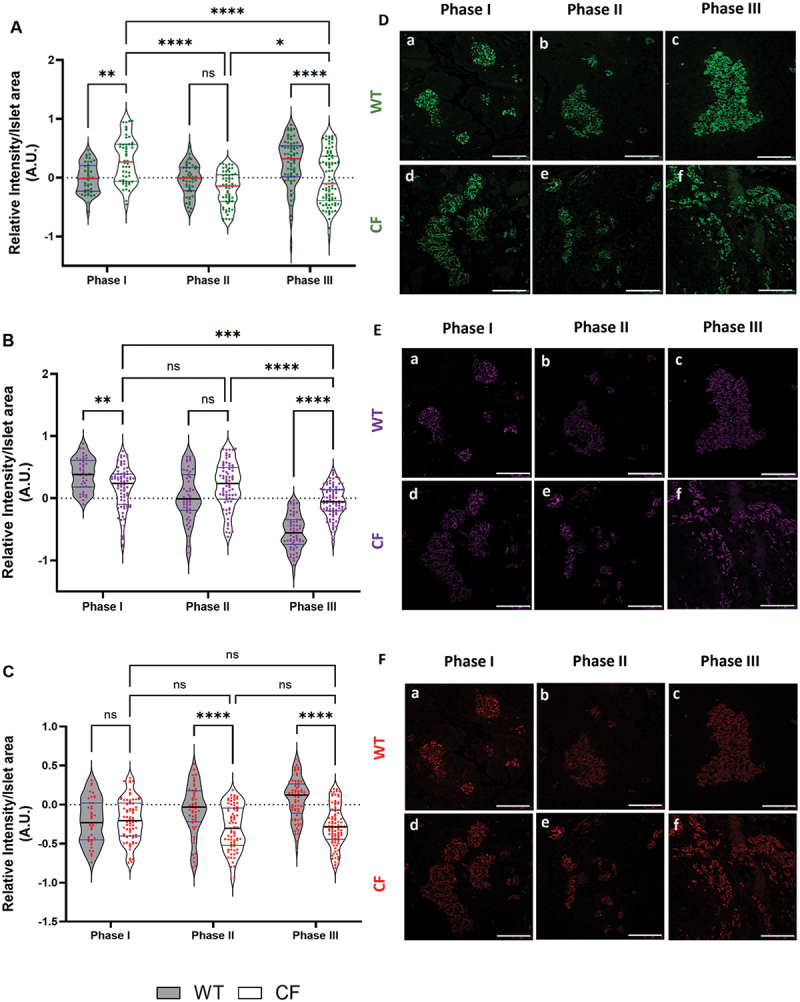
Figure 2.

Changes in immunofluorescence staining intensity per islet area assessed in wild-type (WT) ferrets and CFTR knockout ferrets (CF) using ImageJ. A – C: comparisons of relative intensity across phases I-III were conducted between WT and CF ferrets, along with an assessment of CFRD progression within CF ferrets. (A) insulin, (B) glucagon, (C) proinsulin. D – F: Representative images of immunofluorescence staining in Phase I, Phase II, and Phase III for both WT and CF ferrets (D) insulin, (E) glucagon, (F) proinsulin. Scale bar = 75 µm. The analysis included 150–245 islets from 2–4 biological replicates for each genotype in each phase. The data were transformed using log10 and analyzed with parametric tests. Two-way ANOVA and Tukey’s multiple comparisons post hoc test was employed to assess statistical significance, and the results are presented as mean-values ± SEM, and significance level is denoted by asterisks with (****p < 0.0001, ***p < 0.001, **p < 0.01, *p < 0.05).
