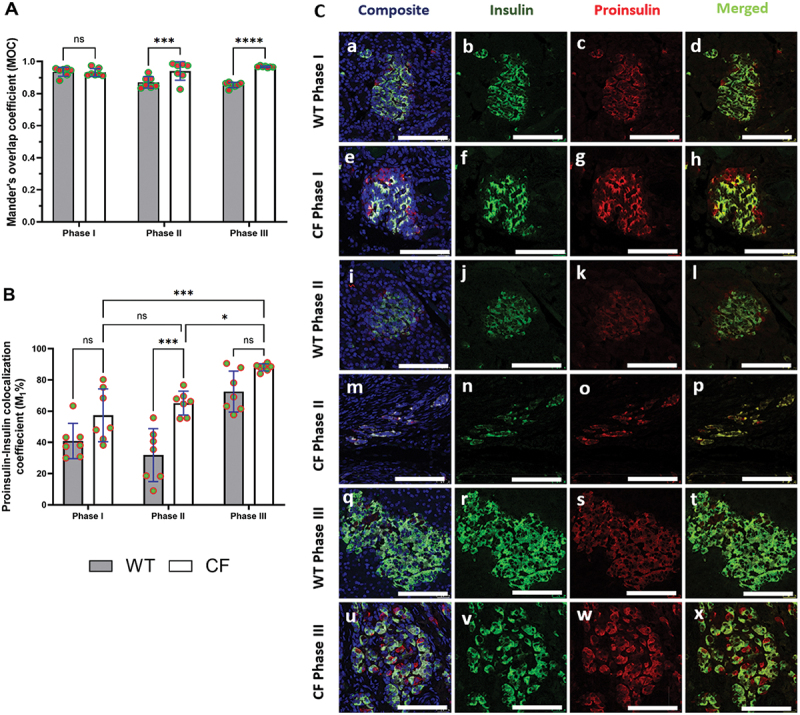
Figure 4.

(A) histogram displaying the distribution of the Mander’s overlap coefficient (MOC) of insulin/proinsulin co-localization. (B) illustrating the rate of proinsulin-to-insulin colocalization (M1%). Immunofluorescence images for each genotype across phases I-III, focusing on islets within beta cells in pancreatic sections (C). The composite panels display DAPI (nuclei, blue), green panels (insulin), red panels (proinsulin), and merged panels showing overlay or co-localized channels. The scale bar is 25 μm. The data were normally distributed, so parametric tests, including two-way ANOVA followed by Tukey’s multiple comparisons post hoc test, were used to assess statistical significance, results presented as mean values ± SEM. Significance levels indicated as follows: (****p < 0.0001, ***p < 0.001, and *p < 0.05).
