Figure 5.

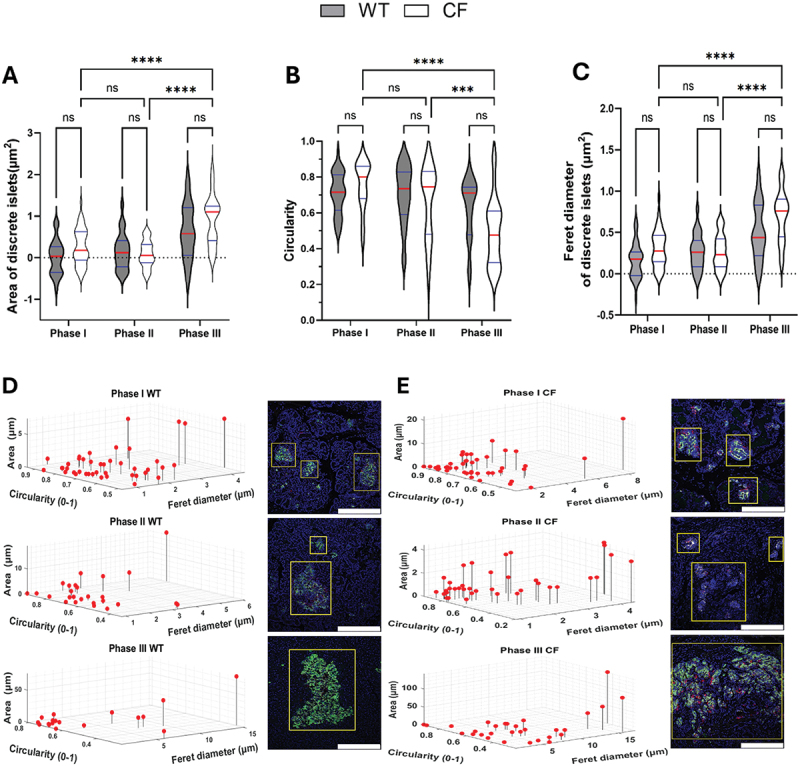
The shape and distribution of islets in both WT and CF ferrets were analyzed to highlight differences between the two groups. This analysis involved assessing key parameters of spatial organization within the pancreas. A-C: violin plot graphs showing quantification of islet area (A), circularity (B), and Feret’s diameter (C) for each genotype across Phases I–III. D and E: three-dimensional visualization of the distribution of islet size (area) and shape (circularity and Feret’s diameter) for WT (D) and CF (E) ferrets, computed with a custom MATLAB script. Each point corresponds to an individual islet or cluster and the regions identified as islets are marked by yellow boxes in the immunofluorescence images, and the scale bar is 75 μm. The analysis included 41–195 islets, from 2 to 4 biological replicates for each genotype in each phase. The data in panels B, D, and E were not transformed to a logarithmic scale to facilitate easier comparison of the actual values. In contrast, the data in panels A and C were log10-transformed and analyzed using a two-way ANOVA followed by Tukey’s multiple comparisons post hoc test, with results presented as mean values ± SEM. Significance levels were indicated as follows: (****p < 0.0001 and ***p < 0.001).
