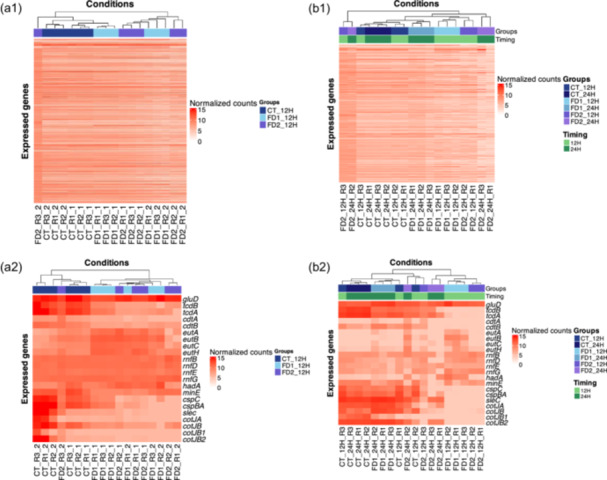
Figure 3.

Heatmap of normalized counts of whole Clostridioides difficile S0756 genes using complexHeatmap in R studio v4.2.2. (a1) Heatmap representing the expression of the three conditions (CT, FD1, and FD2) at time 12 h of Analysis 1 (n = 6). (a2) Heatmap showing the expression of the genes of interest and their normalized values. The experimental conditions were clustered according to the similarity of their expressions. (b1) Heatmap showing the expression of the three conditions (CT, FD1, and FD2) at 12 h and 24 h of Analysis 2 (n = 3). Two headbands are shown: the first one represents the groups and the second one represents the time. (b2) Heatmap representing the expression of the genes of interest and their normalized counts. The two headbands represented in b1 and b2 follow the same organization: the first one represents the group factor and the second one represents the time factor.
