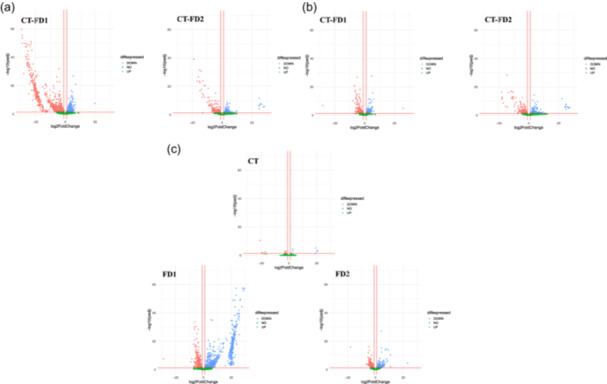
Figure 4.

Effect of the presence of bacterial microbiota on Clostridioides difficile gene (a and b) and effect of the time on C. difficile gene (c). (a) Bacterial microbiota effects at 12 h using Experiment 2. The DESeq2 analysis has compared the normalized data between FD1 and FD2 at 12 h (n = 3), with CT as baseline. This is a representation of the significant genes that are downregulated or upregulated in FD1/FD2 compared to no bacterial microbiota. Most of the FD1/FD2 genes are downregulated compared to the control. (b) Bacterial microbiota effect at 24 h using Experiment 2. The DESeq2 analysis has compared the normalized data between FD1/FD2 and CT at 24 h (n = 3), with CT as baseline. This is a representation of the significant genes that are downregulated or upregulated in FD1/FD2 compared to no bacterial microbiota. (c) Time effect using Analysis 2. The DESeq2 analysis has compared the normalized data between 12 h and 24 h in the same condition, with 12 h as the baseline for this analysis. This is a representation of the significant genes that are downregulated or upregulated between the two times. Most of the FD1 genes are upregulated in the presence of bacterial microbiota. Volcano plots created using R studio (v4.2.2). The x‐axis shows the log2fold change. The y‐axis shows the −log10 (p adj). The more significant the gene is, the higher the point. Three red lines are shown in the graph, the x‐axis is the log2fold change threshold (−1 and 1) and the y‐axis is the significance level (p‐value < 0.05). ( ) UP: genes upregulated (
 ) DOWN: genes downregulated (
 ) NO: nonsignificant genes.
