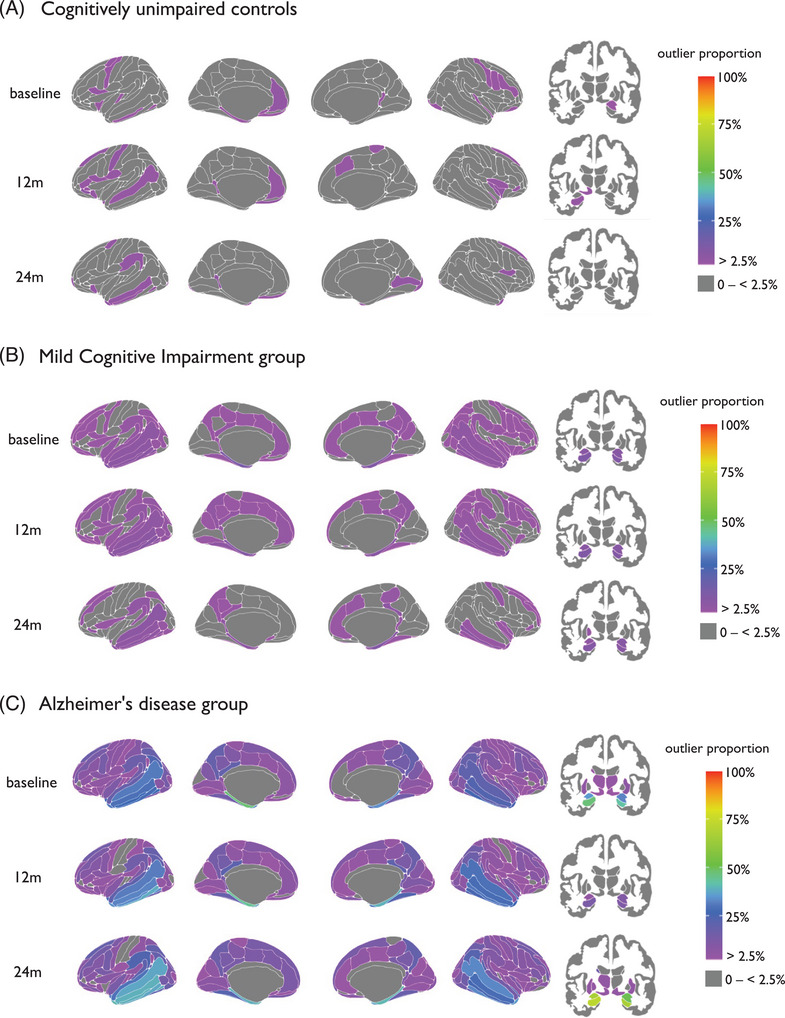
FIGURE 2.

Mapped are the percentage of outliers present in (A) cognitively unimpaired controls, (B) mild cognitive impairment, and (C) Alzheimer's disease at baseline, 12 months, and 24 months, for cortical (left) and subcortical (right) areas. The color bar reflects the outlier proportion from 2.5% to 100% (thresholding of z scores). Zero percent (gray) represents that no participants have outliers in those respective regions.
