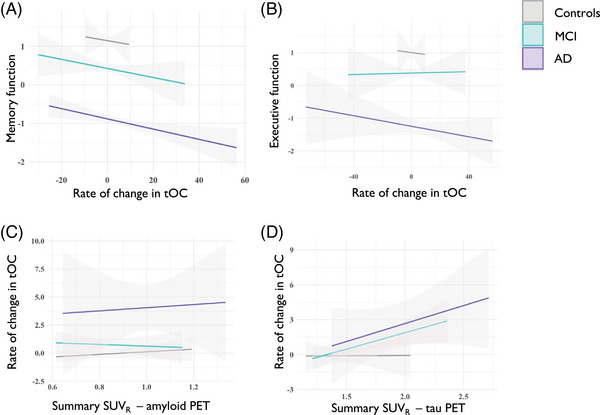
FIGURE 6.

The relationship between cognitive function and cerebrospinal fluid markers with the rate of change in tOC. Fitted lines are from a linear regression model per diagnostic group for (A) memory function, (B) executive function, (C) summary SUVR amyloid PET, (D) summary SUVR tau PET. AD, Alzheimer's disease; MCI, mild cognitive impairment; PET, positron emission tomography; SUVR, standardized uptake value ratio; tOC, total outlier count.
