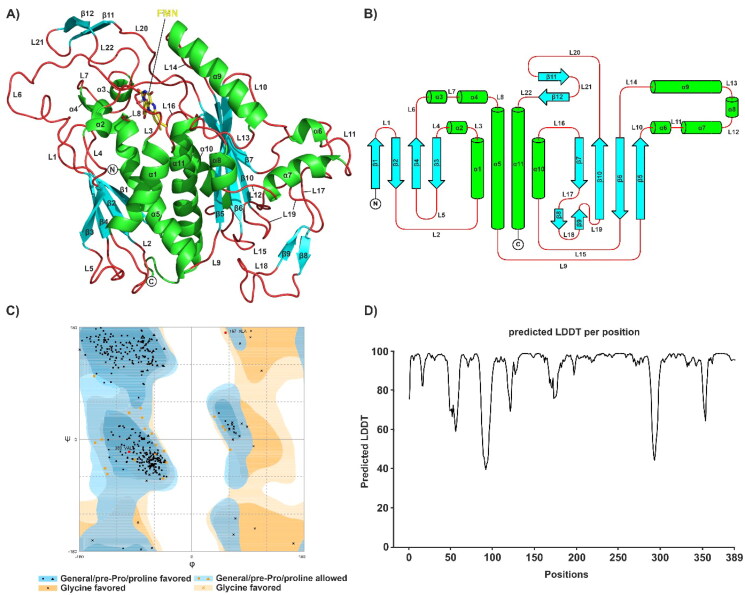
Figure 6.
AlphaFold prediction and evaluation. (A) AlphaFold2 model of PbCS colour-coded by secondary structure (α-helices, green; β-sheets, cyan; loops, red). FMN is shown as yellow sticks; secondary structure elements are annotated. (B) Topology plot of PbCS colour-coded according to (A). (C) Ramachandran plot of PbCS. Of all residues, 94.0%, 5.4% and 0.6% are in the favoured, allowed and outlier regions, respectively. Red squares indicate residues (A197 and V360) in the outlier region of the plot. (D) The predicted-LDDT-per-residue plot for the AlphaFold2 model of PbCS.

