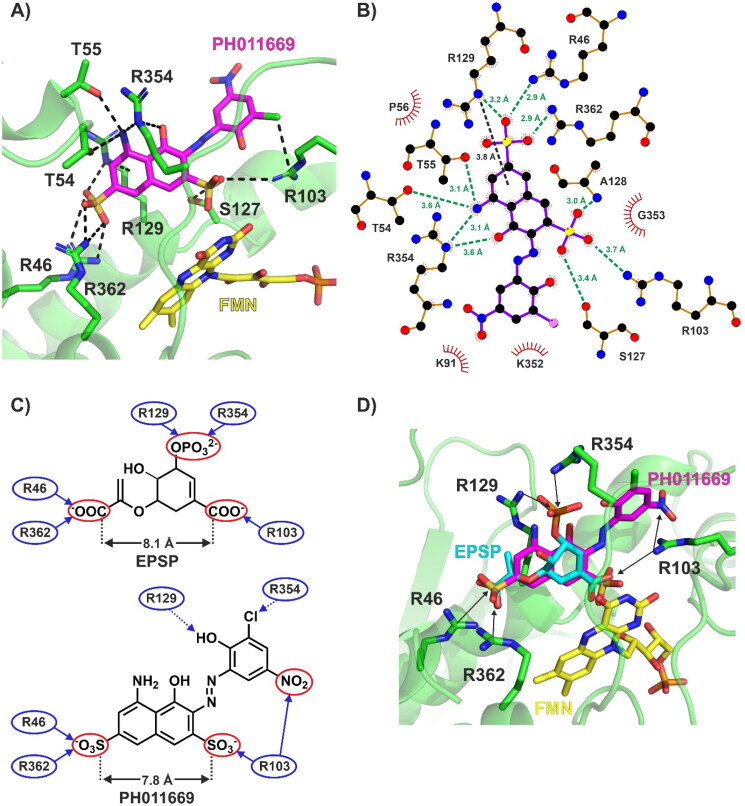
Figure 7.
Interactions between PH011669 and PbCS-FMN, as predicted by molecular docking. (A) Best binding pose of PH011669 within the active site of PbCS-FMN. The enzyme is illustrated as a transparent green cartoon, with interacting residues shown as sticks. Black dashed lines indicate electrostatic and polar interactions. The interaction between R129 and the inhibitor is a cation-π interaction. (B) Protein–ligand interaction plot (LigPlot) of the calculated PbCS-FMN-PH011669 complex. Green dashed lines indicate electrostatic and H-bond interactions while the black dashed line indicates cation-π interactions; bond distances are also shown. (C) Schematic comparison of the binding mode of EPSP and PH011669 in PbCS. Only the main contributors to the binding of EPSP and PH011669 are depicted for clarity. Solid and dashed blue arrows indicate strong (interaction distance: <3.2 Å) and weak (interaction distance: 3.3–4.0 Å) interactions, respectively. (D) Superimposition of the best docking pose of PH011669 on the EPSP pose found in the crystal structure 1QXO. The enzyme is shown as a green cartoon, with interacting amino acids depicted as sticks. PH011669 and EPSP are illustrated as magenta and cyan sticks, respectively. Black arrows indicate interactions between the ligands and PbCS.

