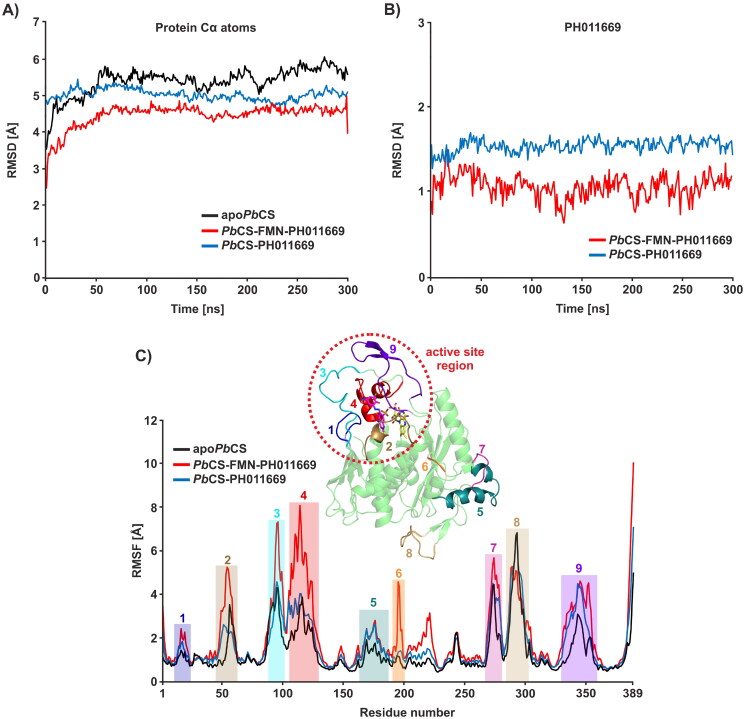
Figure 8.
RMSD and RMSF plots for all systems. (A) RMSD plots for the Cα atoms of PbCS in all systems. (B) RMSD plots for the atoms of PH011669 in the binary and ternary complex. (C) RMSF plots for all systems. Residue regions exhibiting pronounced flexibility are annotated and marked by coloured boxes. The PbCS model is depicted as a green cartoon with the flexible regions annotated and coloured according to the RMSF profile to visualise where those regions are located in the structure. The dashed red circle highlights the active site region. RMSD and RMSF values were averaged over three trajectories for the apo and ternary systems and over nine trajectories for the binary system.

