Figure 9.
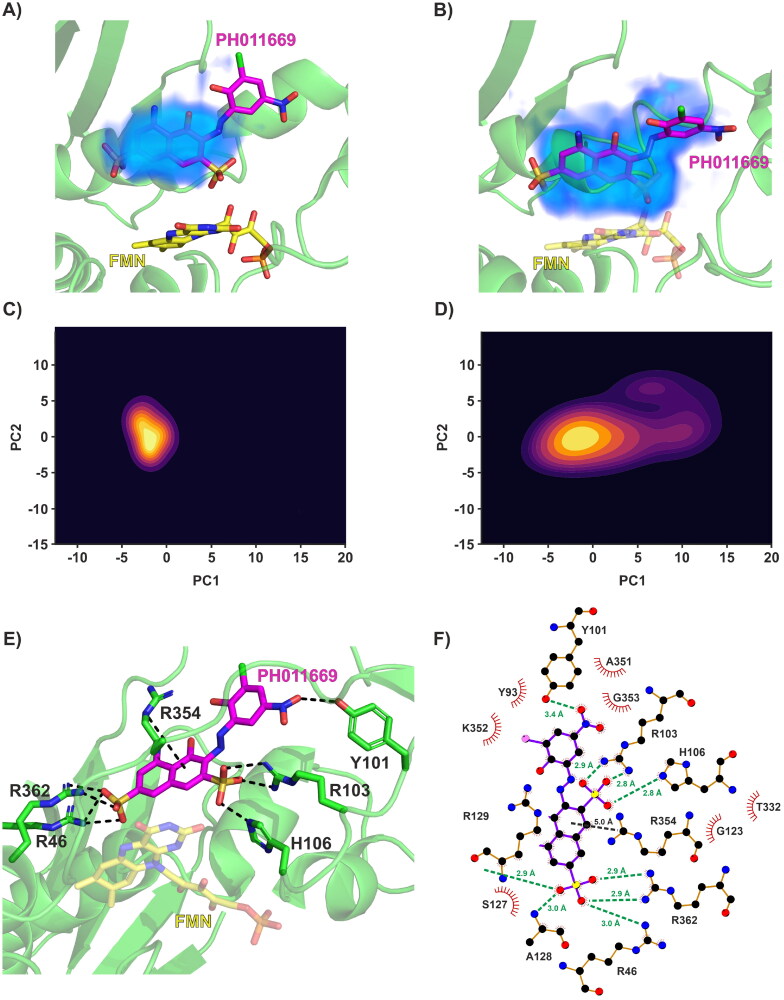
Post-molecular dynamics analysis of the PbCS-FMN-PH011669 and PbCS-PH011669 systems. Sampling of inhibitor conformations from the MD trajectories of the (A) ternary and (B) binary systems. Sampled conformations are shown as residence densities for PH011669 (blue volumes). For better comparison, FMN (transparent sticks) is also depicted in the FMN-lacking binary system (B). Note the differences in the size and shape of the density between the binary (B) and ternary (A) complex. Due to its high flexibility, the 3-chloro-2-hydroxy-5-nitrophenyl ring did not produce sufficient data points to be visualised as a density, so the shown densities mainly originate from the naphthalene disulfonate core. (C) Principal component analysis (PCA) of PH011669 in the ternary complex. (D) PCA of PH011669 in the binary complex. PCAs are depicted as heatmaps showing the motion of the inhibitor. The heatmaps are coloured by PH011669 density (yellow = highly populated inhibitor poses; purple = less populated inhibitor poses). (E) Representative PH011669 pose within the active site of PbCS. The representative structure was taken from a frame of a trajectory located in the centre of the most populated cluster in the PCA plot (D). The enzyme is illustrated as a transparent green cartoon, with interacting residues shown as sticks. Black dashed lines indicate electrostatic and polar interactions. The interaction between R354 and the inhibitor is a cation-π interaction. (F) Protein–ligand interaction plot (LigPlot) of the representative PH011669 pose. Green dashes indicate electrostatic and polar interactions while black dashes indicate cation-π interactions; bond distances are also shown.

