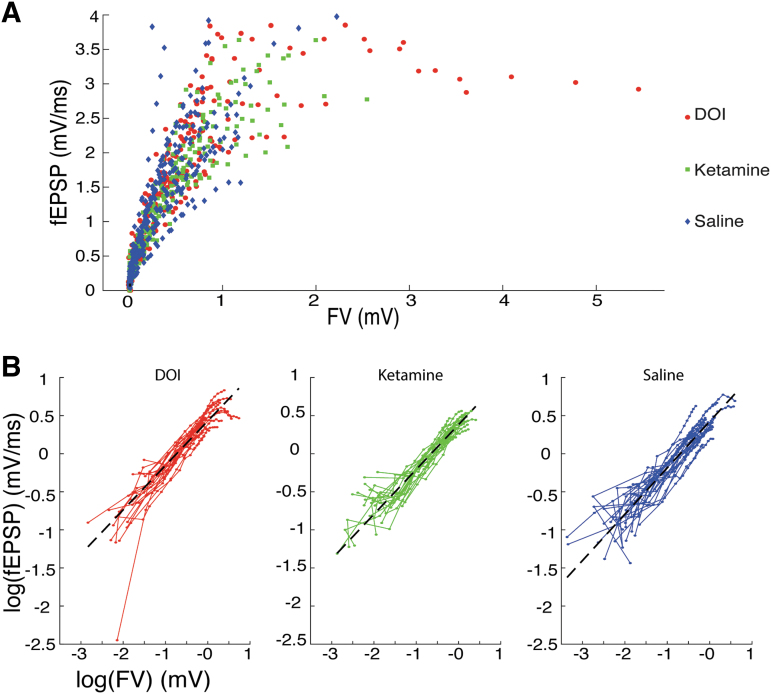
FIG. 6.
No effect of treatment on fEPSPs when plotted versus FV amplitude. (A) Stimulus–response data from all slices and all treatment groups showing overlap of data when plotted as a function of FV amplitude. (B) Data from (A) separated by treatment group and plotted on a log-log scale to demonstrate suitability for linear regression analysis. We found no significant difference in fitted slopes (saline: 0.608; DOI: 0.583; ketamine: 0.588) or intercepts (saline: 0.423; DOI: 0.429; ketamine: 0.382) between treatment groups (all p-values >0.226).

