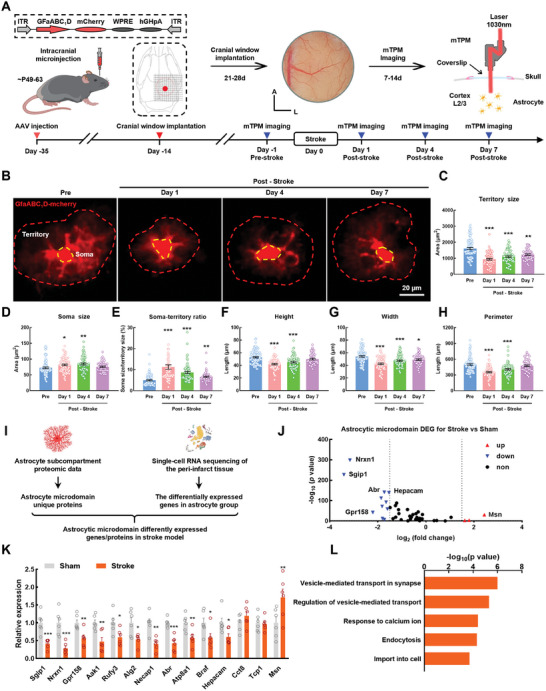
Figure 1.

Alterations in astrocytic microdomains are dynamically manifested after stroke. A) Schematic of the approach for imaging of astrocytic morphology in vivo. Left: Cerebral cortex AAV injection for expressing mCherry in astrocyte. Middle: A cranial window was prepared for head‐fixed imaging with a hole (diameter = 5.0 mm). Right: Astrocyte morphological imaging with mTPM. mTPM: mini two‐photon microscope. Down: Illustration of the experimental procedure. B) Representative images of single astrocytes from same field of view in same mice peri‐infarct area at ‐1, 1, 4, 7d after stroke. C–H) Summary plots of the astrocyte morphological parameters: territory size (C), soma size (D), territory‐to‐soma ratio (E), height (F), width (G), perimeter (H). Pre = 90 astrocytes, Day 1 = 76 astrocytes, Day 4 = 67 astrocytes, Day 7 = 50 astrocytes. Data are shown as mean ± SEM. * P < 0.05, ** P < 0.01, *** P < 0.001 versus the Pre group using one‐way ANOVA followed by the Holm–Sidak post hoc multiple comparisons test. I) Schematic diagram of astrocytic microdomain different expression genes in stroke model. J) Volcano plot showing significantly differentially expressed genes (P < 0.01, |log2(fold change)| >1.5). K) qRT‐PCR validation of 14 genes differentially expressed in peri‐infarct area. n = 6 mice per group. Data are shown as mean ± SEM. * P < 0.05, ** P < 0.01, *** P < 0.001 versus the sham group using the Mann‐Whitney U test. L) Bar graph showing the top five significant GO terms in protein‐protein interaction enrichment analysis. Pre: Pre‐stroke; DEGs: differentially expressed genes.
