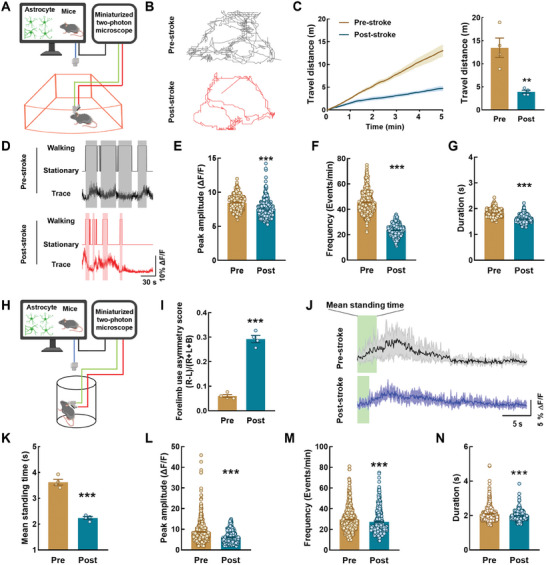
Figure 3.

Astrocytic microdomain Ca2+ transients are attenuated during free behavior in ischemic stroke mice with impaired sensorimotor function. A) Schematic of the approach for imaging of astrocyte calcium signals in free moving mice with mTPM. B) Representative track traces of locomotor activity in free moving mice from Pre‐stroke and Post‐stroke mice. C) Travel distance in Pre‐stroke and Post‐stroke mice within 5 min. n = 4 mice. Data are shown as mean ± SEM. ** P < 0.01 versus the Pre group using the Mann‐Whitney U test. D) Representative traces of microdomain Ca2+ in Pre and Post. Shaded areas indicate walking state. E–G) Quantification of microdomains GCaMP6f signal peak amplitude (E), frequency (F), and duration (G) derived from 552 microdomains from Pre‐stroke mice and 363 microdomains from Post‐stroke mice. Data are shown as mean ± SEM. *** P < 0.001 versus the Pre group using the Mann‐Whitney U test. H) Schematic of the approach for imaging of astrocyte calcium signals in cylinder test with mTPM. I) Assessment of sensory and motor function. Data are shown as mean ± SEM. *** P < 0.001 versus the Pre group using the Mann‐Whitney U test. J) Representative traces of microdomain Ca2+ in Pre and Post. Shaded areas indicate standing state. K) Graphs showing mean standing time in Pre and Post group, n = 4 mice. Data are shown as mean ± SEM. *** P < 0.001 versus the Pre group using the Mann‐Whitney U test. L–N) Quantification of microdomains GCaMP6f signal peak amplitude (L), frequency (M), and duration (N) derived from 562 microdomains from Pre‐stroke mice and 364 microdomains from Post‐stroke mice. Data are shown as mean ± SEM. *** P < 0.001 versus the Pre group using the Mann‐Whitney U test. Pre: pre‐stroke; Post: post‐stroke.
