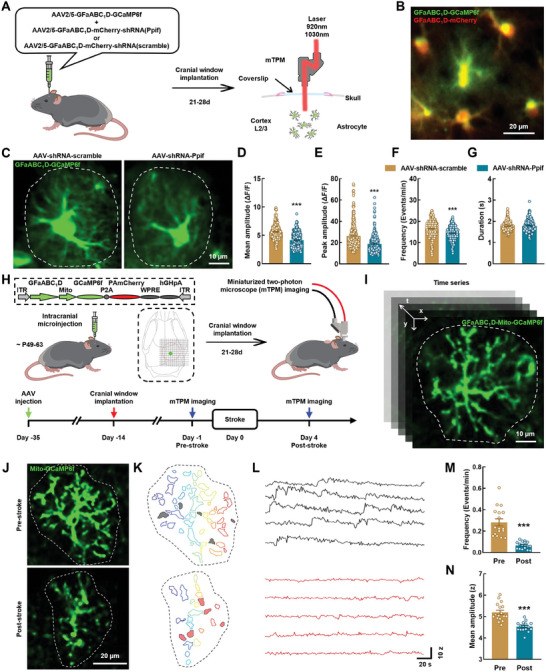
Figure 4.

The mitochondrial Ca2+ transients in astrocytic microdomains are diminished after stroke. A) Schematic of AAVs administration and two‐channel miniaturized two‐photon microscope imaging. B) Representative image show dual channel imaging. Scale bar, 20 µm. C) Representative images from healthy mice showing spontaneous GCaMP6f activity in astrocytes. Scale bar, 10 µm. D–G) Quantification of microdomains GCaMP6f signal mean amplitude (D), peak amplitude (E), frequency (F), and duration (G) derived from AAV‐shRNA‐scramble group (302 microdomains, 3 mice) and AAV‐shRNA‐Ppif group (252 microdomains, 3 mice). Data are shown as mean ± SEM. *** P < 0.001 versus the AAV‐ shRNA‐scramble group using the Mann‐Whitney U test. H) Schematic of the approach for imaging of astrocyte mitochondrial calcium signals in vivo. Left: Cerebral cortex AAVs injection for expressing mitoGCaMP6f in astrocyte. Right: Astrocyte mitochondrial calcium signal imaging with mTPM. I) Representative time series images showing astrocyte mitochondrial calcium signals. Scale bar, 10 µm. J) Median intensity projection image of 3000 frames from one astrocyte in one mouse from Pre‐stroke and Post‐stroke group. Dashed lines indicate cell border. Scale bar, 20 µm. K) Map of microdomains recorded in (J). L) Intensity versus time traces for five microdomains (corresponding to colors in K) showing characteristics of Ca2+ transients in different groups. M–N) Graphs showing events/domain and mean amplitude in Pre‐stroke (17 cells, 4 mice) and Post‐stroke (16 cells, 4 mice) mice. Data are shown as mean ± SEM. *** P < 0.001 versus the Pre group using the Mann‐Whitney U test. mTPM: mini two‐photon microscope; Pre: pre‐stroke; Post: post‐stroke.
