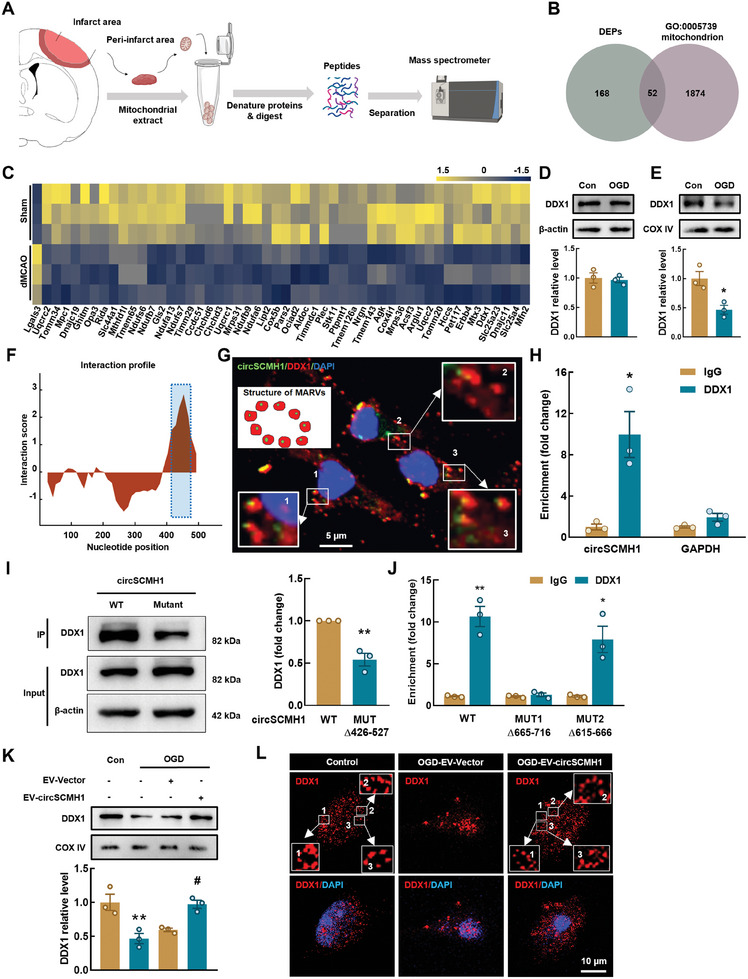
Figure 5.

DDX1 binding with circSCMH1 promotes the formation of MARVs. A) Schematic illustration of mitochondrial protein mass spectrometry from the peri‐infarct area. B) Venn diagram showing numbers of proteins with significant changes in expression (DEPs: fold change > 1.1 or < 0.5, P < 0.05). DEPs: differentially expressed proteins. C) The heatmap shows the different expression of the 52 proteins in (B) proteins expression levels are standardized and displayed as gradient colors from higher (olive yellow) to lower (misty blue). D) Western blot analysis showing that the DDX1 level does not altered in OGD model (6h) of primary mouse astrocytes. Three representative immunoblots are presented. Data are shown as mean ± SEM. E) Western blot analysis showing that DDX1 is decreased in astrocytic mitochondrion (OGD, 6 h) compared with the control. Three representative immunoblots are presented. Data are shown as mean ± SEM. * P < 0.05 versus the control group using the Student's t test. F) Prediction of circSCMH1‐DDX1 interaction by catRAPID algorithm. G) Colocalization of DDX1 and circSCMH1 in primary astrocytes. Scale bar: 5 µm. H) Interaction between circSCMH1 and DDX1 is validated by RNA immunoprecipitation (RIP) in primary astrocytes. Data are presented as mean ± SEM of 3 independent experiments. * P < 0.05 versus the IgG group using the Student's t test. I) Western blot analysis of DDX1 expression in lysates of primary astrocytes with circSCMH1 or mutated circSCMH1 (Δ426–477) overexpression following biotinylated circSCMH1 probe pull‐down assay. Data are shown as mean ± SEM. ** P < 0.01 versus the WT group using the Student's t test. J) Relative enrichment of endogenous circSCMH1 in mutant DDX1 RIP as measured by qPCR. Data are presented as mean ± SEM of 3 independent experiments. * P < 0.05, ** P < 0.01 versus IgG group using the Student's t test. K) Representative western blots of DDX1 expression in mitochondrion of primary astrocytes with EV‐circSCMH1 transfection at OGD condition. Three representative immunoblots are presented. Data are shown as mean ± SEM. ** P < 0.01 versus the control group; # P < 0.05 versus the OGD‐EV‐Vector group using one‐way ANOVA followed by the Holm–Sidak post hoc multiple comparisons test. L) Representative images of astrocyte immunostaining for DDX1 which participates in the formation of MARVs. Scale bars: 10 µm. OGD: oxygen‐glucose deprivation, WT: Wild type, MUT: Mutant.
