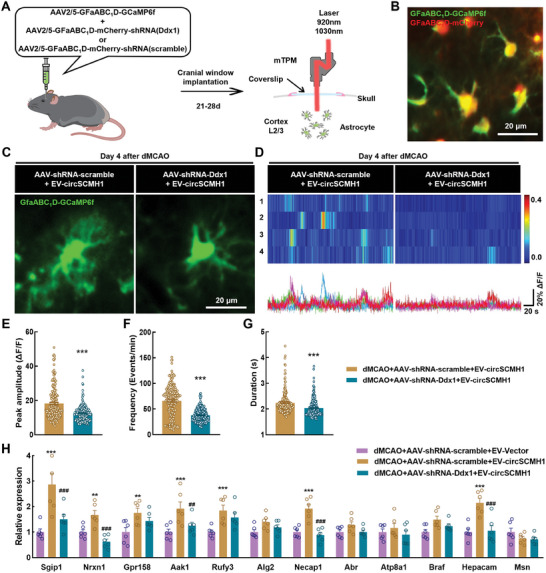
Figure 6.

Interaction between circSCMH1 and DDX1 ameliorates astrocytic microdomain Ca2+ transients after stroke. A) Schematic of AAVs administration and two‐channel miniaturized two‐photon microscope imaging. B) Representative image show dual channel imaging. Scale bar, 20 µm. C) Representative images from stroke mice showing spontaneous GCaMP6f activity in astrocytes. Scale bar, 20 µm. D) Representative microdomain traces and heat map of GCaMP6f signal from Post‐stroke mice. Scale bars, 20 s (horizontal) and 20% ΔF/F (vertical). E–G) Quantification of microdomains GCaMP6f signal peak amplitude (E), frequency (F), and duration (G) in dMCAO + EV‐circSCMH1 + AAV‐shRNA‐scramble (190 microdomains, 3 mice) and dMCAO+ EV‐circSCMH1 + AAV‐shRNA‐Ddx1 (203 microdomains, 3 mice) group. Data are shown as mean ± SEM. * P < 0.05, *** P < 0.001 versus the dMCAO + EV‐circSCMH1 + AAV‐shRNA‐scramble group using the Student's t test. H) qRT‐PCR validation of 12 gene differentially expressed in peri‐infarct area. n = 6 mice per group. Data are shown as mean ± SEM. ** P < 0.01, *** P < 0.001 versus the dMCAO + EV‐Vector + AAV‐shRNA‐scramble group; ## P < 0.01, ### P < 0.001 versus the dMCAO + EV‐circSCMH1 + AAV‐shRNA‐scramble group using one‐way ANOVA followed by Holm‐Sidak post hoc multiple comparisons test.
