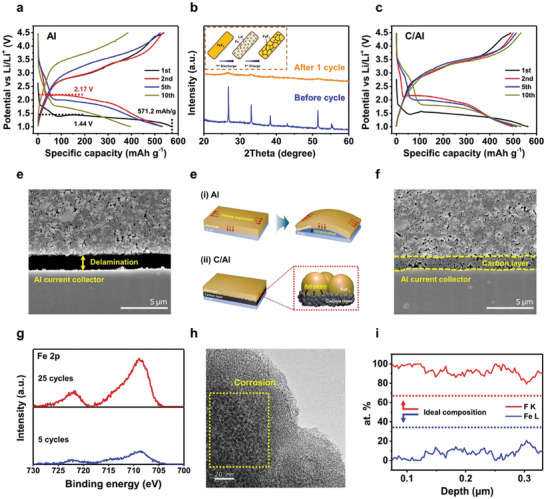
Figure 2.

Electrochemical properties and degradation mechanisms of synthesized FeF2. Voltage profiles of Li‐FeF2 with a) Al, c) C/Al at 0.1C and 30 °C with 1.2 m LiPF6 in EC/EMC (3:7 (v/v)). b) XRD patterns of the electrode before and after 1 cycle. The inset schematic presents nano‐crystallization after the first cycle. Cross‐section images of the electrode after 5 cycles depending on the current collector, d) Al, f) C/Al. e) Schematic image presenting the different electrode behavior depending on the current collector. g) Fe 2P XPS results of Li‐metal anode after 5 and 25 cycles. h) TEM image of FeF2 particle after 25 cycles. i) Elemental atomic percentages of Fe and F by analyzing EELS line scanning.
