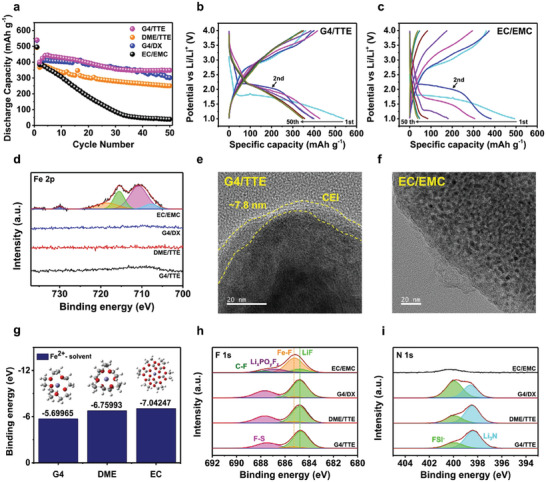
Figure 3.

Electrochemical performance of Li‐FeF2 full cell with various electrolytes and their effect on FeF2. a) Capacity retention of Li‐FeF2 full cell tested at 0.1C and 30 °C. Voltage profiles of Li‐FeF2 full cell with b) G4/TTE, c) EC/EMC. d) Fe 2p XPS data of Li metal after 20 cycles. TEM images of FeF2 particles after 20 cycles with e) G4/TTE, f) EC/EMC. g) Binding energies of solvent with Fe2+ from DFT calculation and corresponding solvation structure (Violet: Fe, Red: O, Gray: C, White: H). XPS data of FeF2 after 20 cycles h) F 1s, i) N 1s.
