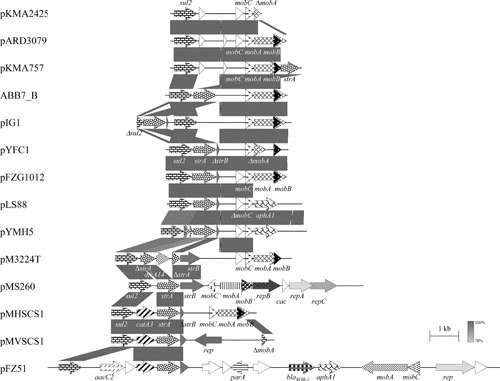
FIGURE 4.

Schematic representation of the structure and organization of selected sul2-based (multi-)resistance plasmids from A. pleuropneumoniae, “A. porcitonsillarum,” A. paragallinarum, H. ducreyi, [H.] parasuis, M. haemolytica, Mannheimia unnamed taxon 10, M. varigena, and P. multocida. Comparison of the maps of the plasmids pKMA2425 (accession no. AJ830714; 3,156 bp) from A. pleuropneumoniae, pARD3079 (accession no. AM748707; 4,065 bp) from A. pleuropneumoniae, pKMA757 (accession no. AJ830713; 4,556 bp) from “A. porcitonsillarum,” ABB7_B (accession no. NC_010941; 4,236 bp) from A. pleuropneumoniae, pIG1 (accession no. U57647) from P. multocida, pYFC1 (accession no. M83717) from M. haemolytica, pFZG1012 (accession no. HQ015158; partially sequenced) from [H.] parasuis, pLS88 (accession no. L23118; 4,772 bp) from H. ducreyi, pYMH5 (accession no. EF015636; 4,772 bp) from A. paragallinarum, pM3224T (accession no. KP197004; 6,050 bp) from A. pleuropneumoniae, pMS260 (accession no. AB109805; 8,124 bp) from A. pleuropneumoniae, pMVSCS1 (accession no. AJ319822; 5,621 bp) from M. varigena, pMHSCS1 (accession no. AJ249249; 4,992 bp) from Mannheimia unnamed taxon 10, pFZ51 (accession no. JN202624; 15,672 bp) from [H.] parasuis, and pKMA757 (accession no. AJ830713; 4,556 bp) from “A. porcitonsillarum.” The map of another sul2-based multiresistance plasmid, pIMD50 (accession no. AJ830711) from “A. porcitonsillarum,” is displayed in Fig. 3. Genes are shown as arrows, with the arrowhead indicating the direction of transcription. The following genes are involved in antimicrobial resistance: sul2 (sulfonamide resistance), strA and strB (streptomycin resistance), catA3 (chloramphenicol resistance), aphA1 (kanamycin/neomycin resistance), and blaROB-1 (β-lactam resistance); plasmid replication: rep, repA, repB, and repC; mobilization functions: mobA, mobB, mobC, mobA′, mobB′, and mobC′; unknown function: open reading frames indicated by white arrows. The prefix Δ indicates a truncated functionally inactive gene. Gray-shaded areas indicate the regions common to plasmids and the different shades of gray illustrate the percentages of nucleotide sequence identity between the plasmids, as indicated by the scale at the bottom of the figure. A distance scale in kilobases is shown.
