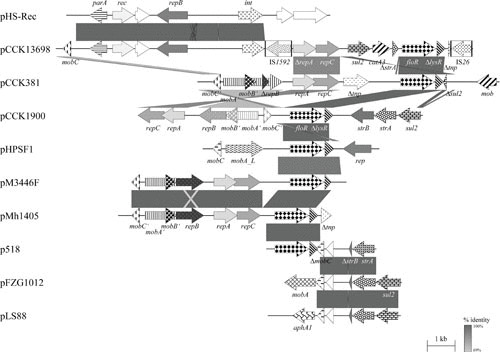
FIGURE 5.

Schematic representation of the structure and organization of selected floR-based (multi-)resistance plasmids from B. trehalosi compared to an in-part-related plasmid from [H.] parasuis, and A. pleuropneumoniae, [H.] parasuis, P. multocida, and sul2-based (multi-)resistance plasmids from H. ducreyi and [H.] parasuis. Comparison of the maps of plasmids pCCK13698 (accession no. AM183225) from B. trehalosi and its in-part-related plasmid pHS-Rec (accession no. AY862436; 9,462 bp) from [H.] parasuis, pCCK381 (accession no. AJ871969; 10,874 bp) from P. multocida, pCCK1900 (accession no. FM179941; 10,226 bp) from P. multocida, pHPSF1 (accession no. KR262062; 6,328 bp) from [H.] parasuis, pM3446F (accession no. KP696484; 7,709 bp) from A. pleuropneumoniae, pMh1405 (accession no. NC_019260; 7,674 bp) from M. haemolytica, p518 (accession no. KT355773; 3,937 bp) from A. pleuropneumoniae, pFZG1012 (accession no. HQ015158; partially sequenced) from [H.] parasuis, and pLS88 (accession no. L23118; 4,772 bp) from H. ducreyi. Genes are shown as arrows, with the arrowhead indicating the direction of transcription. The following genes are involved in antimicrobial resistance: sul2 (sulfonamide resistance), strA and strB (streptomycin resistance), catA3 (chloramphenicol resistance), floR (chloramphenicol/florfenicol resistance), and aphA1 (kanamycin/neomycin resistance); plasmid replication: rep, repA, repB, and repC; mobilization functions: mobA, mobB, mobC, and mob; transposition functions: tnp; recombinase or integrase functions: rec and int; DNA partition: parA; unknown function: open reading frames indicated by white arrows. The prefix Δ indicates a truncated functionally inactive gene. The boxes in the map of pCCK13698 indicate the limits of the insertion sequences IS1592 and IS26; the arrows within these boxes indicate the reading frames of the corresponding transposase genes. Gray-shaded areas indicate the regions common to plasmids, and the different shades of gray illustrate the percentages of nucleotide sequence identity between the plasmids, as indicated by the scale at the bottom of the figure. A distance scale in kilobases is shown.
