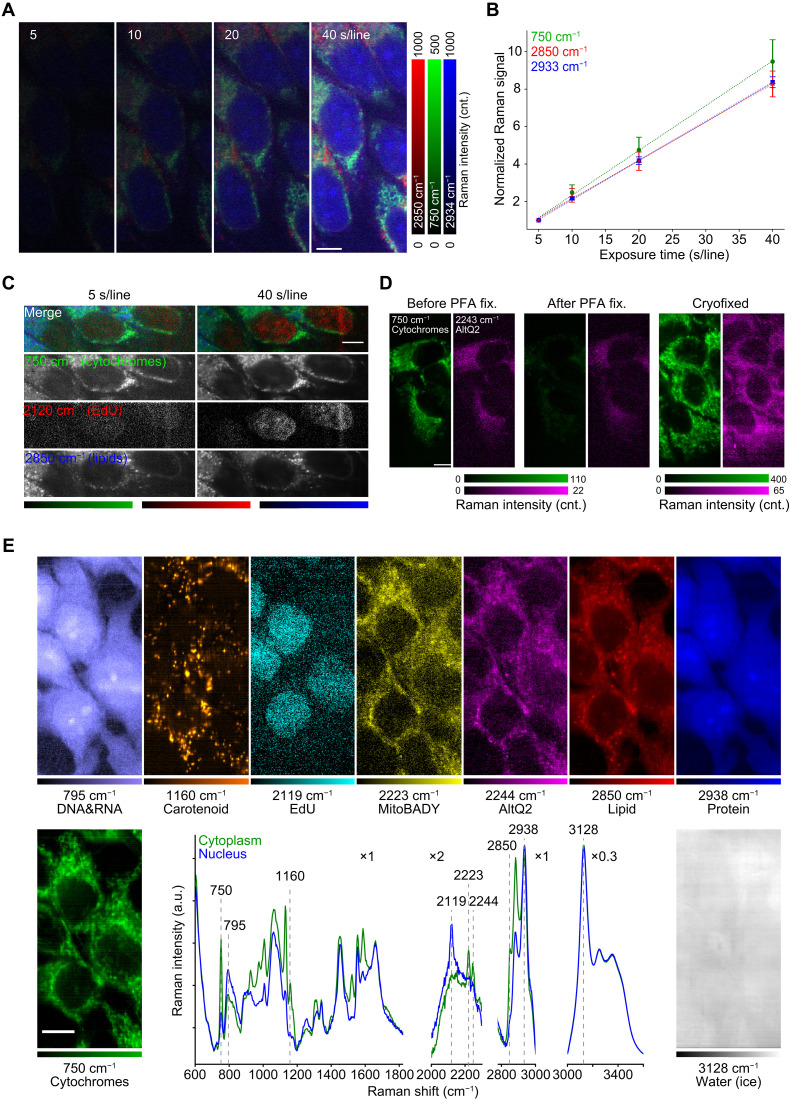
Fig. 2. High-SNR Raman imaging of HeLa cells with cryopreservation of physicochemical states.
(A) Raman images of cryofixed HeLa cells acquired with exposure times of 5, 10, 20, and 40 s per line at 233 K. In data processing, no noise reduction was applied. (B) Raman signal at 750, 2850, and 2933 cm−1 of cryofixed HeLa cells to exposure time. The signal at each exposure time was normalized by the signal at 5 s per line for each Raman band. The normalized signals were averaged over 12 different regions in (A). Error bars show the standard deviation for each Raman band (n = 12). The dotted lines indicate fitting curves calculated by linear functions. In data processing, no noise reduction was applied. (C) Raman images representing EdU incorporated in cryofixed HeLa cells, acquired with exposure times of 5 and 40 s per line at 233 K. Cytochromes and lipids are also shown to clarify the localization of EdU in nuclei. (D) Raman images of living cells (left), chemically fixed cells (middle), and cryofixed cells (right). Measurement temperature were 293 K (left, middle) and 233 K (right). The images represent cytochromes (green) and AltQ2 incorporated in the cells (magenta). (E) Nine-color Raman images and spectra measured at 203 K for the cryofixed HeLa cells loaded with EdU, MitoBADY, and AltQ2. The green and blue lines were acquired from cytoplasm and nucleus, respectively. In the Raman spectra, the scales of lateral axes were modified in each wave-number region, respectively. Exposure time: 10 s per line for living cells and PFA-fixed cells in (D), 30 s per line for cryofixed cells in (D), and 70 s per line for (E). Scale bars, 10 μm. SVD was applied to data shown in (C) to (E) for noise reduction (70). cnt., counts.

