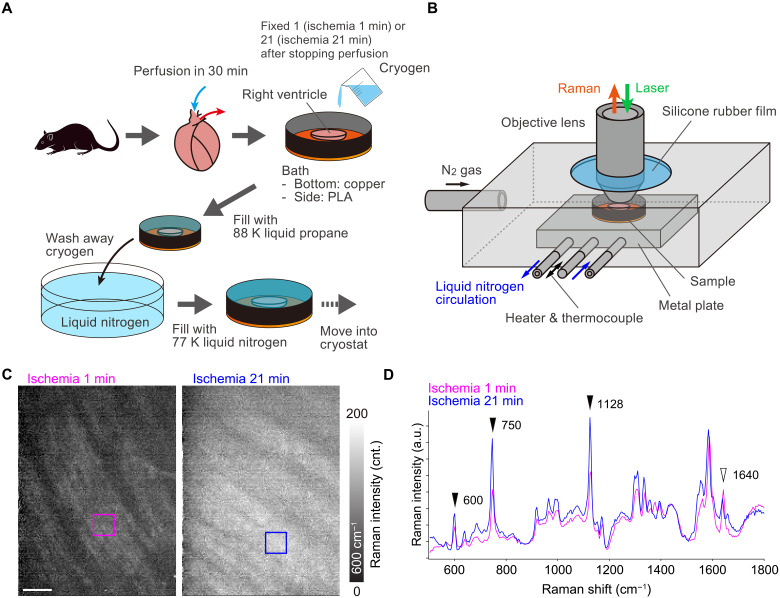
Fig. 3. Rapid freezing and low-temperature Raman imaging of a rat heart.
(A) Procedures of the ischemic injury, rapid freezing, and subsequent transfer of the frozen myocardial tissue to the microscope cryostat (PLA, polylactic acid). (B) Schematic of the cryostat for tissue imaging by an upright Raman microscope. (C) Raman images reconstructed by the intensity at 600 cm−1, assigned to reduced cytochrome c. The hearts were cryofixed at 1 min (left) and 21 min (right) after cessation of perfusion and measured at 153 K. (D) Raman spectra of the frozen rat hearts measured at 153 K. Magenta and blue lines exhibit average spectra taken from magenta and blue squares in (C), respectively. Scale bar, 50 μm. SVD was applied to all data to separate signals from noises (70).

