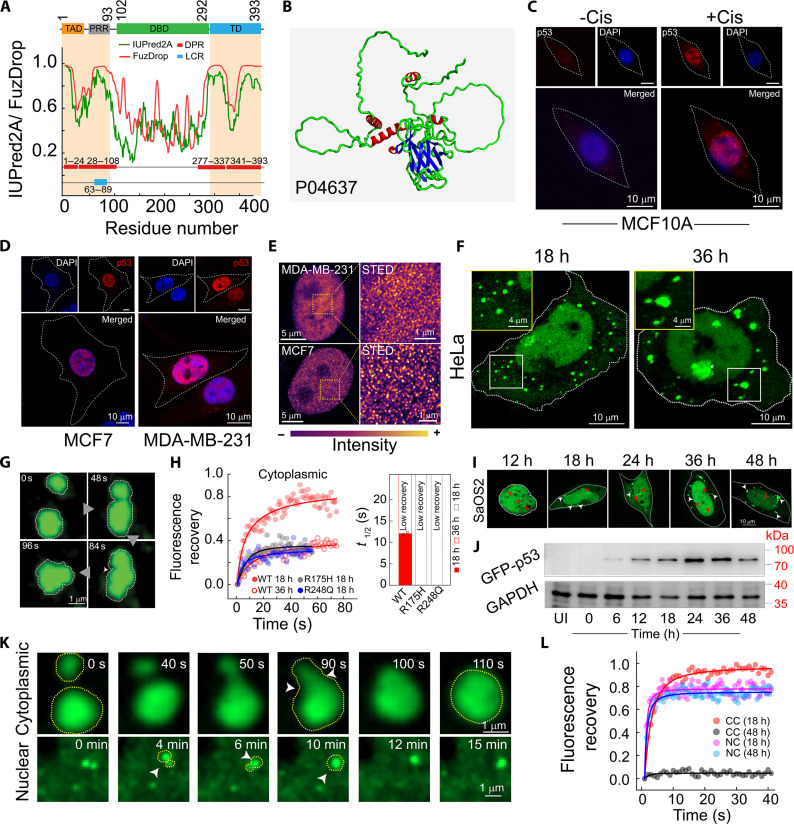
Fig. 1. p53 condensate formation in HeLa and SaOS2 cells.
(A) Domain organization of p53 showing TAD (1 to 61), PRR (64 to 93), DBD (102 to 292), and TD (325 to 393) (top), low-complexity regions (blue) using SMART, disorder tendency (green) using IUPRED2A, residue-based droplet promoting probabilities (red), and droplet-promoting regions (DPR) (red box) using FuzDrop (bottom). (B) Structure of full-length p53 protein as predicted by Alphafold from 229 structures in PDB (UniProt ID P04637). (C) Confocal images of MCF10A cells showing p53 localization with (right) and without (left) cisplatin treatment. (D) The confocal microscopy showing the p53 (red) localization in MCF7 and MDA-MB-231. (E) STED microscopy of MDA-MB-231 and MCF7 cells showing p53 condensate state in the nucleus. Pseudocolor (LUT, mpl-plasma) has been used for representative purposes. (F) HeLa cells overexpressing WT GFP-p53 at 18 and 36 hours show cytoplasmic condensates. h, hours. (G) Time-lapse microscopic images showing fusion of WT GFP-p53 condensates in the cytoplasm of HeLa cells. (H) FRAP curves of cytoplasmic condensates in HeLa cells at 18 and 36 hours showing fluorescence recovery with (right) their corresponding t1/2. Note that the t1/2 for condensates with low recovery was not estimated. (I) Time-dependent expression of WT GFP-p53 in SaOS2 cells showing nuclear (red arrowheads) and cytoplasmic condensates (white arrowheads). (J) Western blot images showing the expression of GFP-p53 with time in SaOS2 cells. (K) Time-dependent confocal images of cytoplasmic and nuclear condensates of WT GFP-p53 showing the fusion event of two condensates. (L) FRAP curves of nuclear (NC) and cytoplasmic condensate (CC) at 18 and 48 hours. All the experiments [(C) to (L)] were repeated two times with similar observations.

