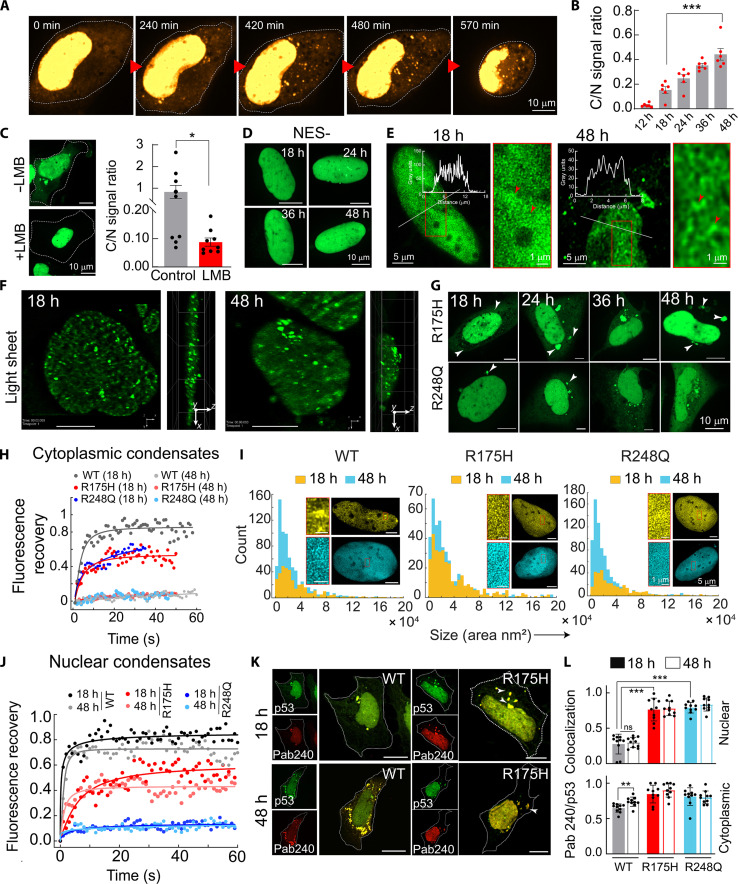
Fig. 2. Spatiotemporal formation of p53 condensates in p53-null SaOS2 cells.
(A) Time-lapse confocal microscopy images showing spatiotemporal formation of p53 condensates. (B) Cytoplasmic/nuclear (C/N) ratio of WT GFP-p53 fluorescence signal in SaOS2 cells with time (mean ± SEM for n = 6 transfected cells). (C) Confocal microscopy images showing the effect of Leptomycin B (LMB) treatment (left) and corresponding C/N ratio calculation (right) of SaOS2 cells (mean ± SEM for n = 9 transfected cells). (D) The time-lapse confocal microscopy showing nuclear localization of the p53 with p53 NES− in SaOS2 cells. (E) STED microscopy of nuclear condensates of WT GFP-p53 at 18 and 48 hours. The line profile represents the intensity of GFP-p53 across the nucleus. (F) Lattice light-sheet imaging of nuclear condensates of SaOS2 transfected with WT GFP-p53 at 18 and 48 hours. Scale bars, 10 μm. (G) p53 condensates of R175H and R248Q in SaOS2 cells monitored over time using confocal microscopy. (H) FRAP recovery profiles of WT, R175H, and R248Q cytoplasmic condensates at 18 and 48 hours. (I) Size (area) and number distribution of nuclear condensates of WT, R175H, and R248Q at 18 and 48 hours, calculated from STED microscopy. Scale bars, 5 μm. (J) FRAP recovery profile of WT, R175H, and R248Q nuclear condensates at 18 and 48 hours. (K) Immunofluorescence study of WT GFP-p53 condensates with misfolded p53 specific antibody (Pab240). Scale bars, 10 μm. (L) Quantification of Pab240 colocalization with GFP-p53 nuclear and cytoplasmic condensates at 18 and 48 hours (mean with SEM, for N = 2). For (B), (C), and (L), the statistical significance was calculated using a two-tailed t test [***P < 0.001, **P < 0.002, *P < 0.033, and P > 0.012 (ns), with 95% confidence interval]. The experiments (A), (C) to (H), (J), and (K) were performed two independent times.

