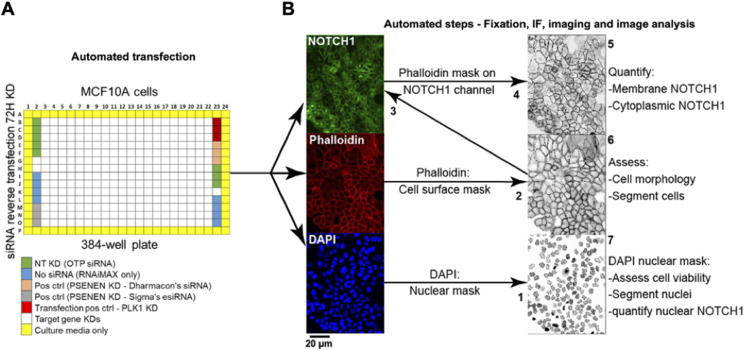
Figure 3. High-content screen pipeline and image analysis strategy.
(A) The primary screen was performed on MCF10A cells in a 384-well format. Genes belonging to a subset of the human genome were knocked down in six replicate plates for 72 h by RNAi along with the listed controls. In a duplicate experiment, cells were stimulated with EGTA. Control wells were distributed on the plates as shown. NT: non-targeting KD – cells were transfected with non-targeting siRNA. No siRNA: cells received RNAiMAX only. Positive control (pos ctrl) – cells were transfected with siRNA against PSENEN. Transfection pos ctrl: cells were transfected with siRNA against polo-like kinase 1 (PLK1) as a cytotoxic indicator of transfection efficiency. Outer wells (yellow) were filled with media to prevent evaporation in experimental wells. (B) To assess endogenous NOTCH1 localization, cells in plates were subjected to automated IF and DAPI/phalloidin labeling to demarcate nuclei and the cell cortex, respectively. The script steps of the image acquisition and analysis developed in-house are as follows: (1) The nuclei were segmented based on DAPI signal. (2) The cell surface was segmented using the phalloidin signal and overlaid on the NOTCH1 channel (3) to quantify levels of cell surface NOTCH1 (4), and the area between the cell cortex and the nuclei was used to determine levels of cytoplasmic NOTCH1 (5). (6) The phalloidin mask was also used to count cells and establish cell-to-cell boundaries. (7) Nuclear size was used as readout of cell viability as compact; pyknotic nuclei identify dead cells. Using such a pipeline, each gene KD was defined by its effects on the amount of NOTCH1 in the cell cortex, in the cytoplasm or in the nucleus.

