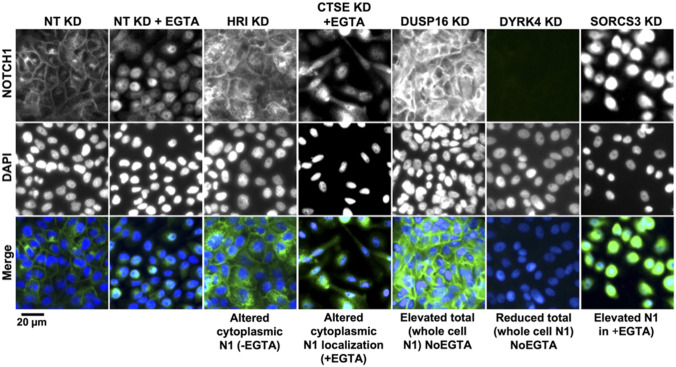
Figure S1. Representative images of the Notch phenotypic classes.
High-content screening (primary screen) widefield images of MCF10A cells treated and immunolabeled as indicated. Genes were grouped into the indicated classes based on their effect on intracellular NOTCH1 (N1) localization in NoEGTA or EGTA conditions.

