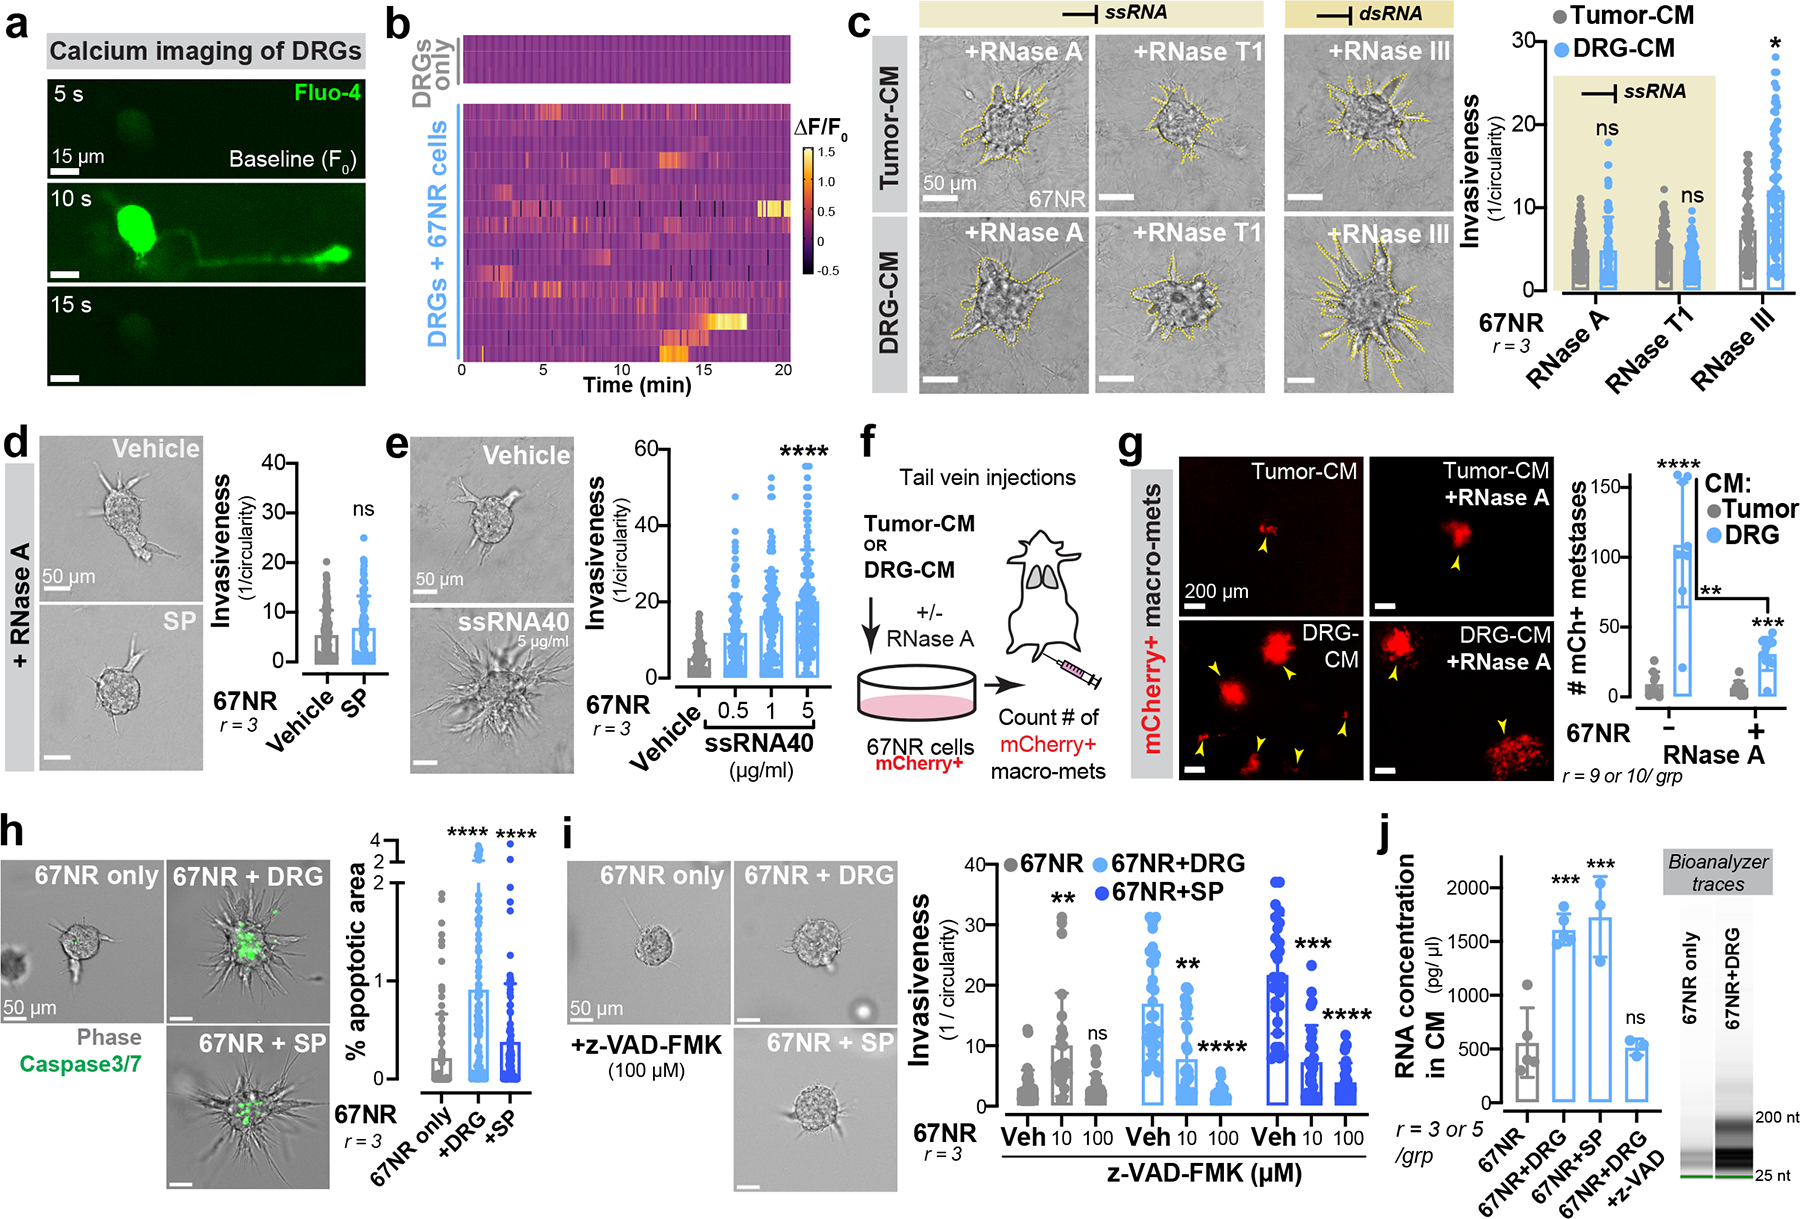
Figure 3: Neuronal SP promotes the release of metastatic ssRNAs from cancer cells.

(a) Time series of a DRG neuron co-cultured with 67NR cancer cells in the presence of the calcium dye Fluo-4.
(b) Spontaneous calcium events (ΔF/F0) in DRG neurons cultured with or without 67NR cancer cells.
(c) 67NR spheroids cultured in tumour-CM or DRG-CM in the presence of either ssRNA- or dsRNA-specific RNases. Left: Representative images. Right: Invasion quantification. nsp > 0.9999, *p = 0.0215, Kruskal-Wallis test. Mean ± SD.
(d) Invasion quantification of 67NR spheroids cultured with SP and RNase A. Vehicle-treated 67NR spheroids (+/−RNase A) are plotted in Extended Data Fig. 6b since the experiments were conducted together. nsp = 0.2416, Mann-Whitney test. Mean ± SD.
(e) Invasion quantification of 67NR spheroids cultured with a ssRNA mimetic. ****p < 0.0001, Kruskal-Wallis test. Mean ± SD.
(f-g) mCherry+ 67NR cancer cells were pre-treated with tumour-CM or DRG-CM with or without RNase A prior to tail vein injections into syngeneic hosts. (f) Schematic. (g) Quantification of mCherry+ metastases. ****p < 0.0001, ***p = 0.0005, **p = 0.0015, Mann-Whitney test. Mean ± SD.
(h) Percent apoptotic area within 67NR cancer cell spheroids when cultured alone, with DRG neurons, or with SP. ****p < 0.0001, Kruskal-Wallis test. Mean ± SD.
(i) Invasion quantification of 67NR spheroids cultured alone, with DRG neurons, or with SP – all in the presence of z-VAD-FMK, a pan-caspase inhibitor. Veh = vehicle. 67NR only group: **p = 0.0056, nsp > 0.9999; 67NR+DRG group: **p = 0.0083, ****p < 0.0001; 67NR + SP group: ***p = 0.0004, ****p < 0.0001. Kruskal-Wallis test.
(j) RNA concentration within conditioned medium of 67NR only, 67NR+DRG (+/−z-VAD-FMK), 67NR+SP cultures. Extracellular RNA species detected are <200 nucleotides. ***p = 0.0002, nsp = 0.8248, ANOVA. Mean ± SD.
