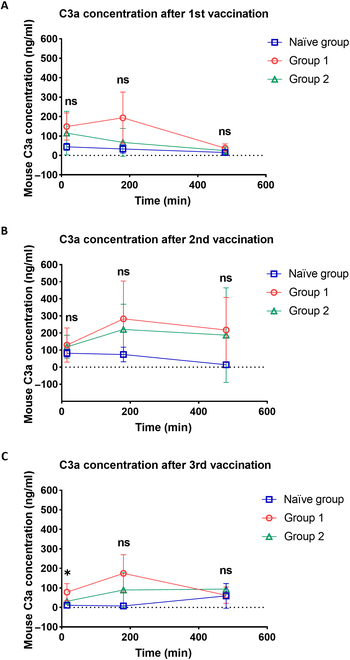
Fig. 6.

Pre-existing anti-PEG antibody release of complement C3a in mouse plasma. We analyzed C3a levels using a commercial ELISA kit after the 1st (A), 2nd (B), and 3rd (C) doses of Comirnaty. C3a concentrations were measured across the 3 groups at 15 min, 3 h, and 8 h. Statistical comparisons between groups were conducted using 2-way ANOVA, followed by Tukey’s multiple comparisons test. Statistical significance is indicated as follows: *P < 0.05, **P < 0.01, and ***P < 0.001, with group 2 compared to the naïve group. Each sample was measured in duplicate (n = 3).
