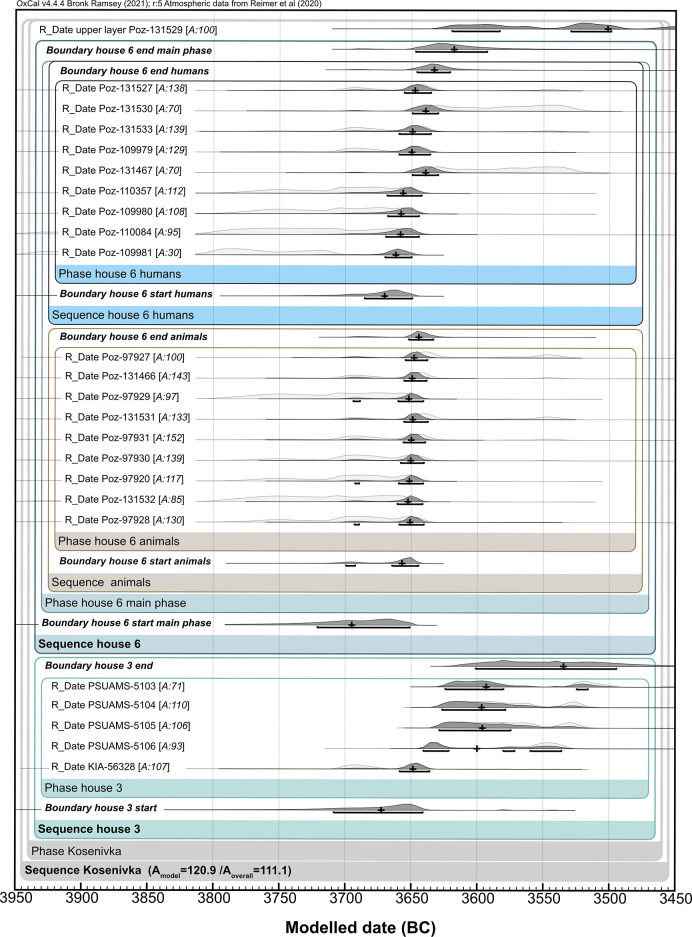
Fig 10. Bayesian modelling of the radiocarbon dates.
We used the OxCal v. 4.4.165 functions “sequence,” “boundary,” and “combine” for considering archaeological context and stratigraphic information ([93]; in conjunction with the INTCAL20 calibration curve). The probability range (dark grey) is 68.3% (1σ). The individual agreement with the overall model is indicated by the A value (%) (in square brackets) per sample (should be >60%). For the modelling code, see S2 Table; for the curve plot, see Fig 20 in S2 Appendix. Illustration: J. Müller, K. Fuchs.

