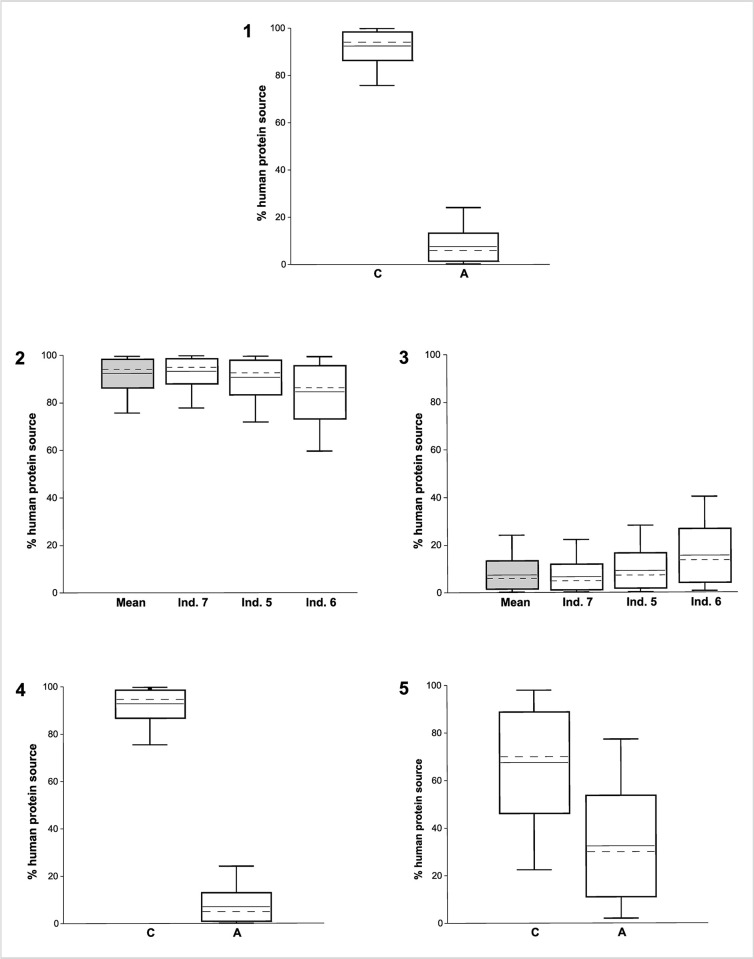
Fig 12. Five models of human dietary protein resources at Kosenivka using the software FRUITS, v. 3.1 [108].
1: Proportions of cereal grain protein (C) and animal meat (A) in the diet of humans from Kosenivka reconstructed from mean δ13C and δ15N values and SEM (Table 4). 2: Proportion of cereals calculated for the human mean (h, n = 3) as in model 1 and for individuals 5–7, arranged by decreasing δ15N in cranial bone collagen. 3: As model 2 but for the proportion of animal meat. 4, 5: Results for food source inputs to the human diet considering either δ13C (4) or δ15N (5) as a single fraction in the FRUITS model (see S2 Table). Boxes span 1 standard deviation from the mean (horizontal line); whiskers span 2 SD; medians are marked by discontinuous lines. Illustration: F. Schlütz, K. Fuchs.

