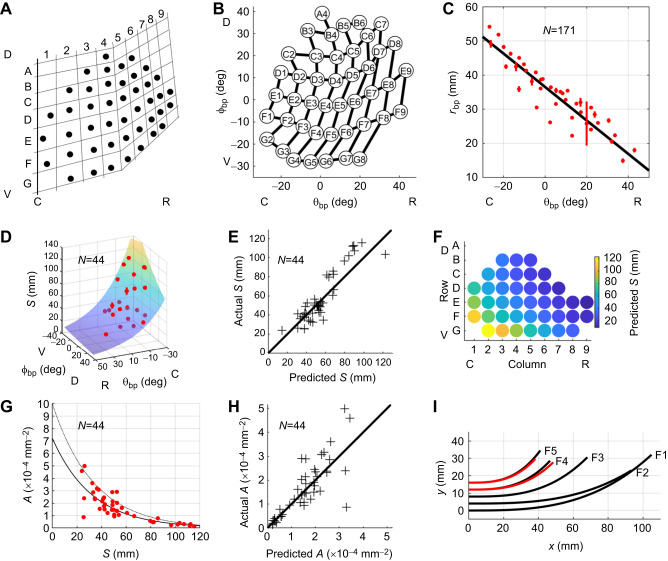
Fig. 2.
Locations of whisker basepoints and their relationship to 2D whisker geometry. (A) Qualitative description of the shape of the harbor seal whisker array. Figure recreated from Dehnhardt and Kaminski (1995). (B) Plotting φbp against θbp quantifies array geometry in a manner that closely resembles the qualitative description in A. (C) Radial basepoint coordinate (rbp) plotted as a function of θbp for N=171 basepoints. Black line represents Eqn 1. Mean values of rbp when grouped by row and column identity are shown as red dots; red vertical bars indicate standard errors. (D) Arclength (S) plotted as a function of θbp and φbp. The surface represents Eqn 2. Mean values of S when grouped by row and column identity are shown as red dots; red vertical bars indicate standard errors. (E) Experimentally measured values for arclength (S) compared with values predicted from Eqn 2. Black diagonal line indicates equality. D and E contain data from N=44 whiskers. (F) A colormap illustrates variations in arclength predicted by Eqn 2 across the array. (G) Cubic curvature coefficient (A) can be described as an exponentially decreasing function of arclength. Solid black line represents Eqn 4 and dotted gray line represents Eqn 5. Red dots are experimentally measured values of A. (H) Experimentally measured values for curvature coefficient (A) compared with values predicted from Eqn 4. Black diagonal line indicates equality. G and H contain data from N=44 whiskers. (I) Black traces show shapes of the F-row whiskers from a single seal. Whiskers F4 and F5 from two other seals are shown in red to illustrate shape variability. C, caudal; R, rostral; V, ventral; D, dorsal.

