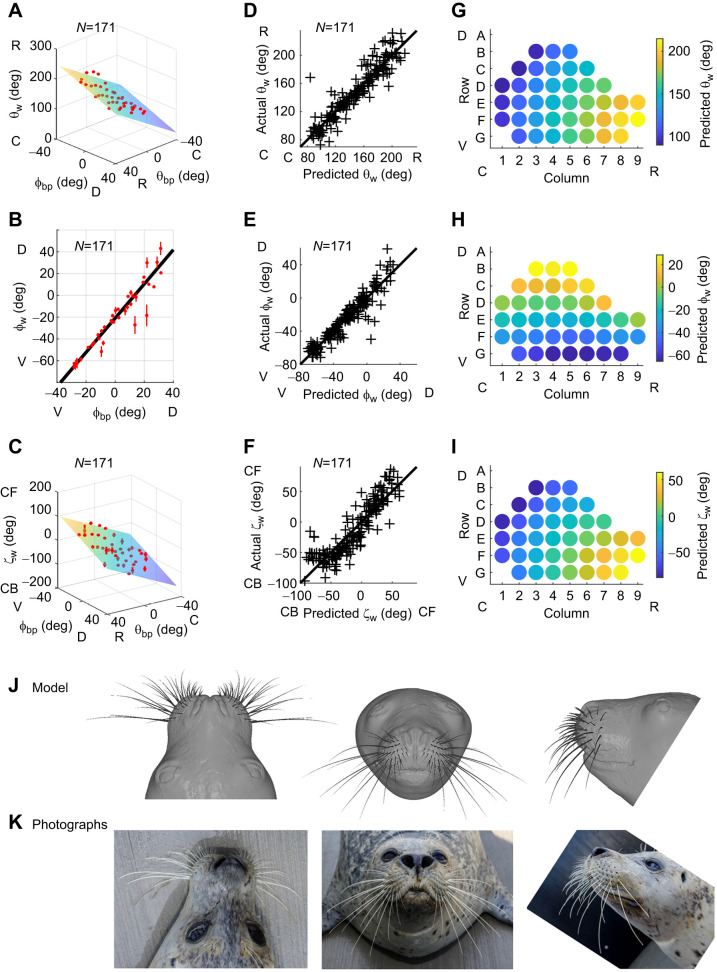
Fig. 3.
Quantifying the relationship between whisker angles of emergence and basepoint coordinates allows construction of a CAD model of the whisker array. (A–C) The horizontal angle of emergence (θw) fitted to Eqn 6, the elevation angle of emergence (φw) fitted to Eqn 7 and the twist angle of emergence (ζw) fitted to Eqn 8. For all plots, means±s.e.m. when grouped by whisker identity are shown in red. (D–F) Actual values of θw, φbp and ζw compared with values predicted from Eqns 6, 7 and 8. All plots reveal relatively uniform dispersion of actual versus predicted values about y=x, indicating that correct models were selected. A–F show data for N=171 whiskers. (G–I) The plots show how values for θw, φbp and ζw will vary across the array, as predicted by Eqns 6, 7 and 8. (J) A 3D model of the average seal whisker array is shown superimposed on a CAD model of the seal's head. The head model was created using 3D laser scans of seal 2, with the exception of the eyes and portions of the top of the head (see Materials and Methods). (K) Photographs of seal 2 permit visual comparison between the real animal and CAD models for both head and whisker array. C, caudal; R, rostral; D, dorsal; V, ventral; CF, concave forwards; CB, concave backwards.

