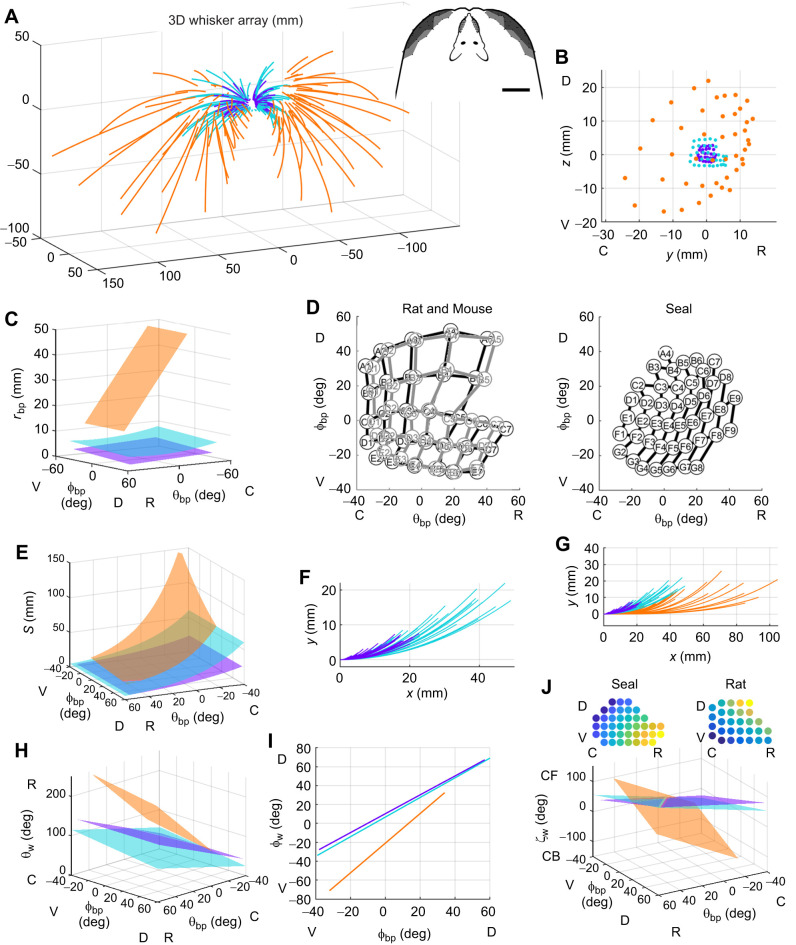
Fig. 4.
The harbor seal whisker array compared with arrays of rats and mice. In all panels, data for harbor seals are in orange, data for rats (from Belli et al., 2018) are in teal, and data from mice (from Bresee et al., 2023) are in purple. (A) Full 3D geometric models of seal, rat and mouse whisker arrays shown in standard position and orientation. Inset: top-down views comparing rat and seal arrays. Scale bar: 20 mm. (B) Whisker basepoints plotted in the sagittal (y–z) plane. (C) Plotting rbp as a function of basepoint position highlights size differences between species. (D) To normalize for head size, mean whisker basepoint locations for all three species are plotted in θbp and φbp. In these angular coordinates, seal whisker basepoints (right; same data as in Fig. 2B) are spaced more densely than mouse and rat whisker basepoints (left, overlayed). (E) Whisker arclength (S) plotted as a function of basepoint position (θbp and φbp). (F) Seal whiskers are fitted with cubic equations, while mouse and rat whiskers are fitted with quadratic equations. (G) The large overlap in mouse and rat whisker shapes, revealed in an expanded view of F. Proximal portions of all whiskers are aligned with the x-axis. (H–J) Rostral–caudal emergence angle (θw), elevation emergence angle (φw) and twist emergence angle (ζw) plotted as functions of basepoint position (θbp and φbp). The insets in J show heatmaps for the values of ζw for seal and rat. For both animals, the gradient of twist angle varies linearly with θbp and φbp, but the gradient of the seal twist angle is orthogonal to that of the rat. C, caudal; R, rostral; D, dorsal; V, ventral; CF, concave forwards; CB, concave backwards.

