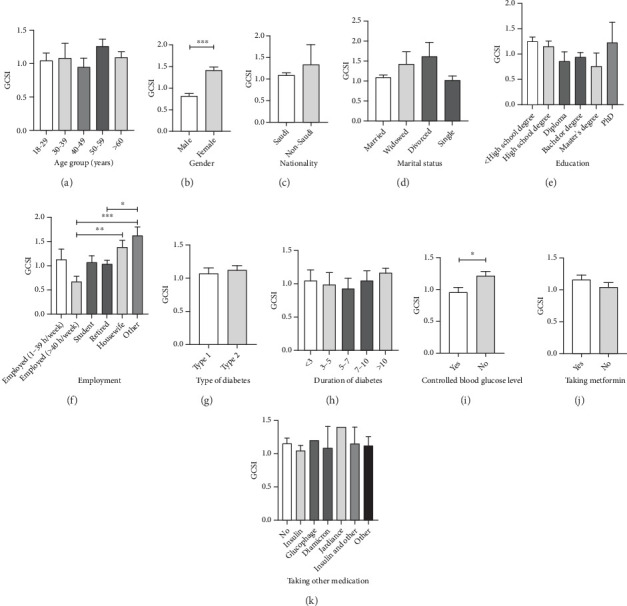
Figure 1.

Differences in GCSI overall score based on study demographic groups of (a) age, (b) gender, (c) nationality, (d) marital status, (e) education, (f) employment, (g) type of diabetes, (h) duration of diabetes, (i) controlled blood glucose level, (j) taking metformin, and (k) taking other medication for diabetes mellitus. Data were expressed in bars showing means and standard error of measurements (SEMs). ∗Significant difference from the control group (∗p < 0.05, ∗∗p < 0.01, and ∗∗∗p < 0.001).
