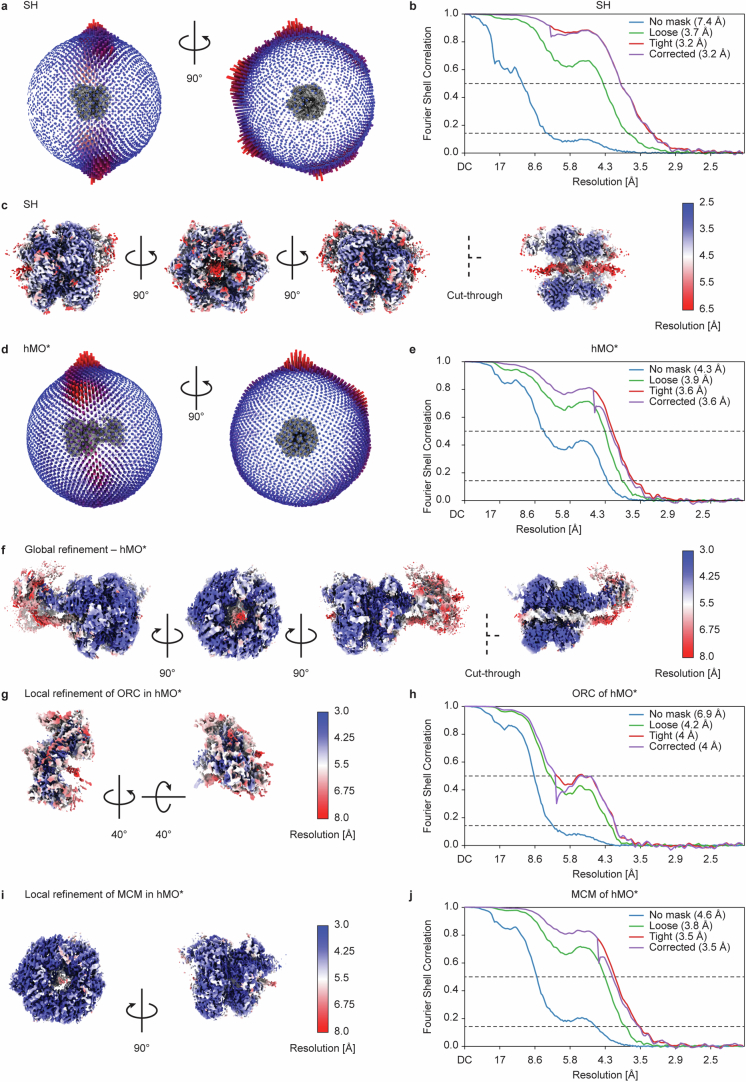
Extended Data Fig. 6.
a, Angular distribution of the hSH structure that was obtained in the presence of ATP. b, Fourier shell correlation plot for the hSH structure. c, Three rotated views and one cut-through view of the hSH structure, color-coded according to the local resolution as estimated in cryoSPARC. d, Angular distribution of the globally refined hMO* structure. e, Fourier shell correlation plot for the globally refined hMO* structure. f, Three rotated views and one cut-through view of the globally refined hMO* structure, color-coded according to the local resolution as estimated in cryoSPARC. g, Locally refined ORC structure in the hMO*, color-coded according to the local resolution as estimated in cryoSPARC. h, Fourier shell correlation plot for the locally refined ORC structure. i, Locally refined MCM structure in the hMO*, color-coded according to the local resolution as estimated in cryoSPARC. j, Fourier shell correlation plot for the locally refined MCM structure.

