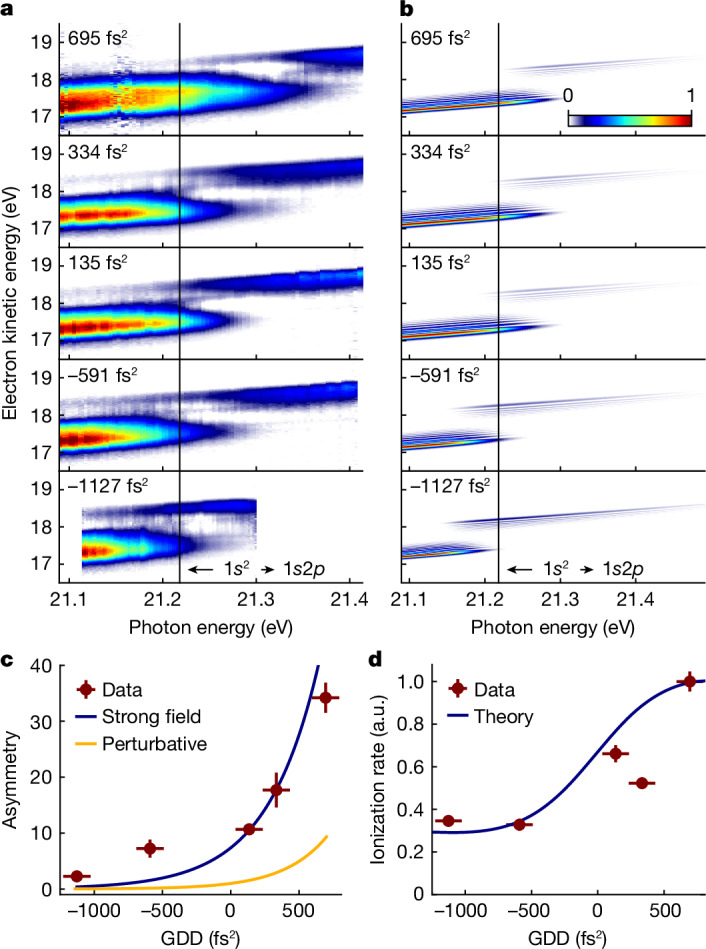
Fig. 4. Energy-domain representation of the quantum control scheme.

a, Photoelectron spectra as a function of energy detuning for different GDD values as labelled (Ieff = 2.92(18) × 1014 W cm−2). b, TDSE-SAE calculations. Broadening by the instrument response function is omitted in the model. c, Amplitude ratio between the upper and lower photoelectron bands evaluated at the 1s2 → 1s2p resonance; hence, δ = 0. Experimental data (red), TDSE-SAE model treating the bound and continuum dynamics non-perturbatively (blue) and TDSE-SAE model applied to the bound-state dynamics, but treating the continuum perturbatively (yellow). d, Dependence of the He ionization rate on the spectral phase of the driving field. Data (red) and TDSE-SAE model (blue). a.u., arbitrary units.
