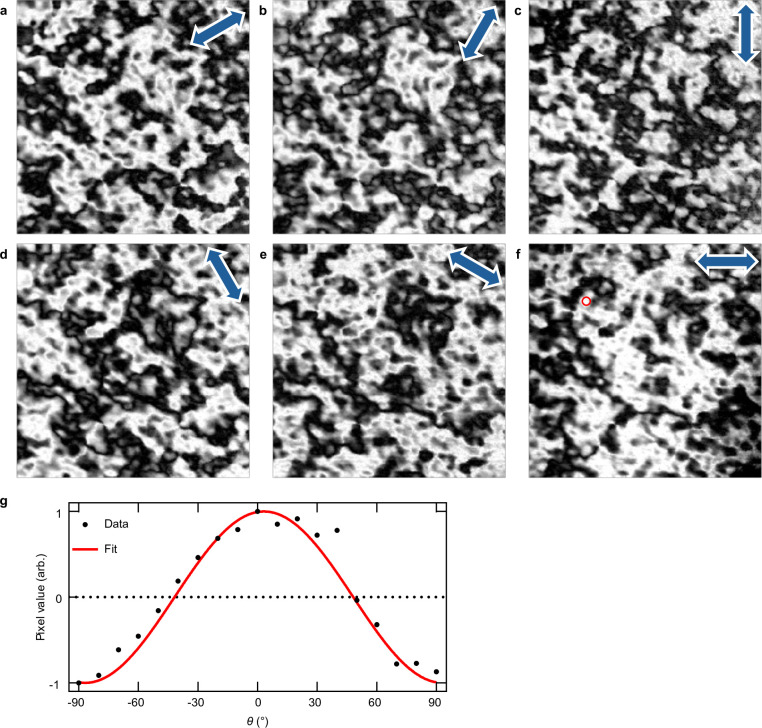
Extended Data Fig. 7. Calculating the Néel vector axis from XMLD-PEEM images with rotated X-ray linear polarization vector.
a-f, Normalised XMLD-PEEM images of the open-space region presented in Fig. 1 of the main text, for X-ray linear polarization vector (blue double-headed arrow) at −30°, −60°, 90°, 60°, 30°, and 0° to the horizontal axis. g, Normalised XMLD intensity (of pixel circled in f), for the full set of X-ray linear polarization angles, θ, between −90° and 90° in steps of 10°. The fit encodes information about the local Néel vector axis, ϕ. In this example, ϕ = 41. 8°. Repeating the fitting process for every pixel location produces the XMLD map shown in Fig. 1d of the main text.

