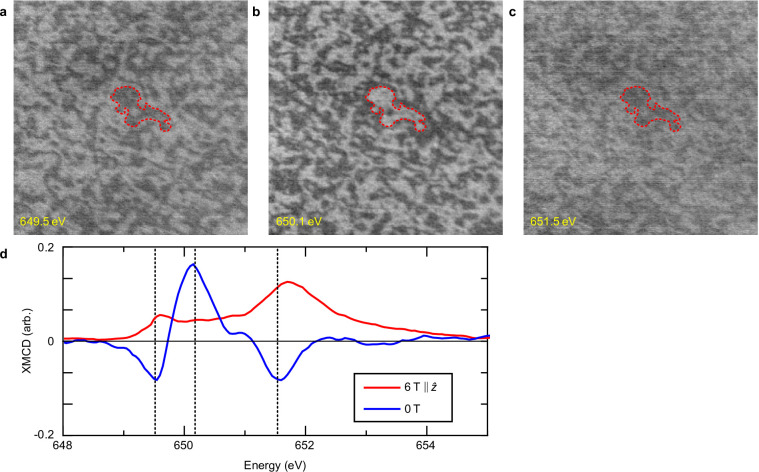
Extended Data Fig. 1. XMCD reversal across the Mn L2 resonance edge.
a-c, XMCD-PEEM images measured at 649.5 eV, 650.1 eV, and 651.5 eV, respectively. The red outline highlights a domain in the centre of the image to aid the viewer in identifying the contrast reveral. d, Mn L2 XMCD spectra in zero field (blue) and at 6 T (red), taken from ref. 12. The vertical dashed lines indicate the peaks in the zero field XMCD, where the XMCD-PEEM images in a-c were recorded. The zero field XMCD reverses sign between the three different energies, consistent with a-c, which the 6 T XMCD has positive sign across the whole L2 multiplet.

