
Fig. 1. Genetic correlations between neurodevelopmental conditions and other brain-related traits and conditions.
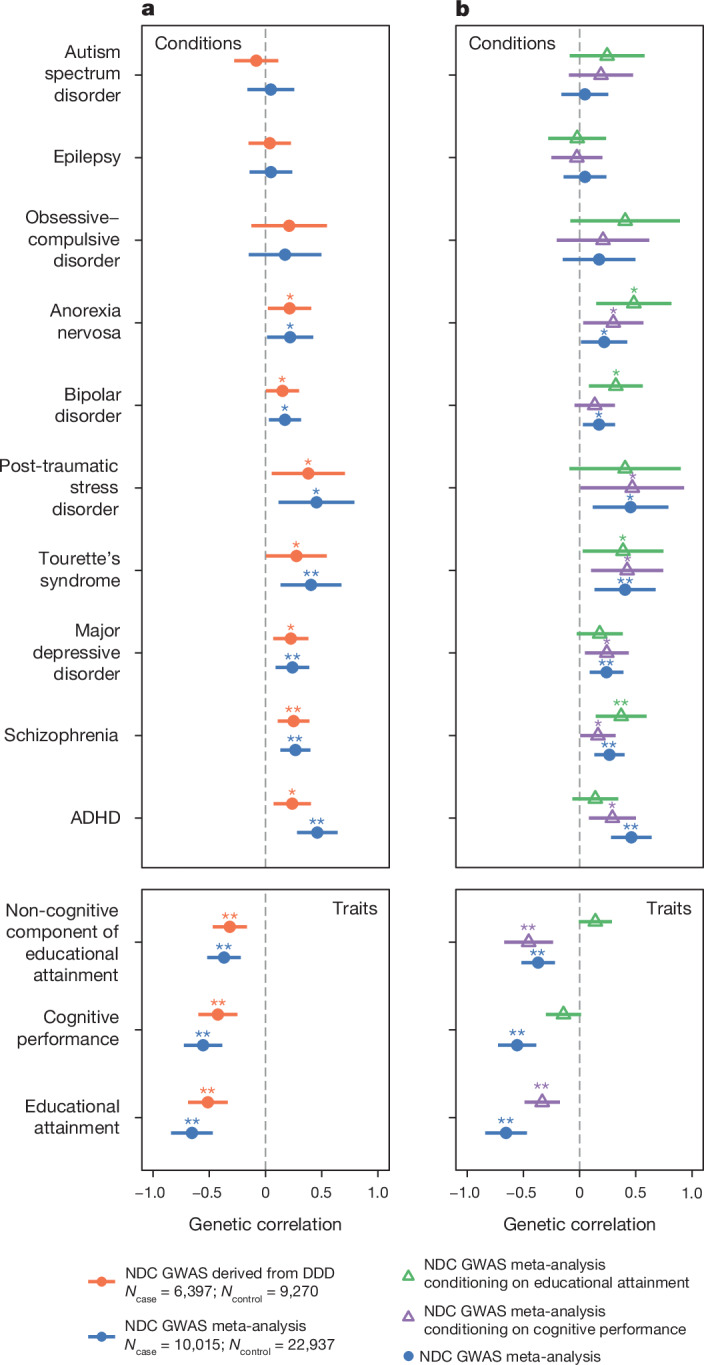
a, Points show the estimates from linkage disequilibrium score regression for the DDD GWAS (orange) and the meta-analysis of neurodevelopmental conditions (NDCs) between DDD and GEL (blue). b, Points show the estimates for the meta-analysis after conditioning on the GWAS summary statistics for educational attainment (green) or cognitive performance (purple) using GenomicSEM. Error bars show 95% confidence intervals. One asterisk indicates nominally significant results (*P < 0.05) and a double asterisk indicates significant results that passed the Bonferroni correction for 13 traits and conditions (**P < 0.0038). Exact estimates and two-sided P values are reported in Supplementary Table 4.