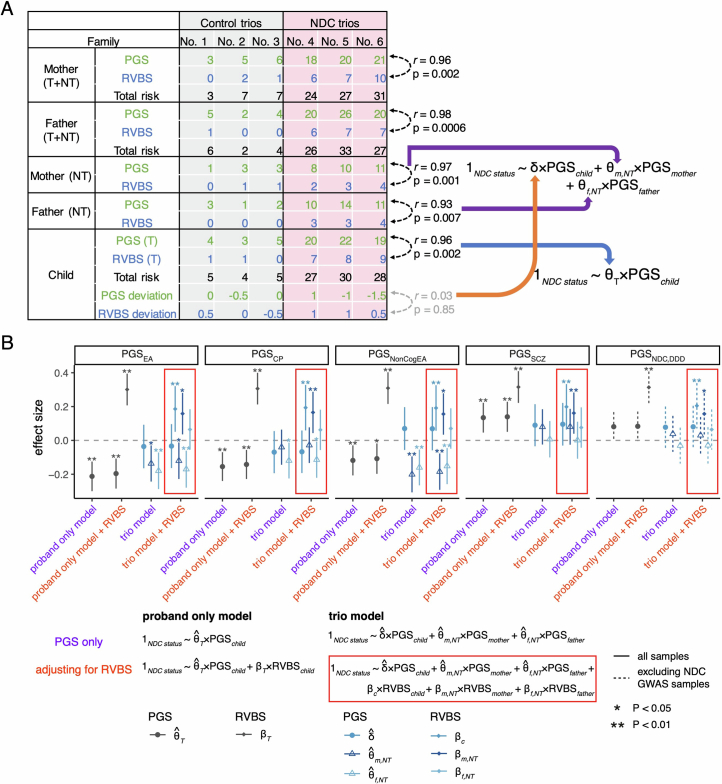
Extended Data Fig. 10. Exploring how the correlation between rare and common variant components of risk for NDCs affects estimates from the trio model.
(A) Illustration of how assortment-induced correlation between common and rare components of risk for neurodevelopmental conditions affects the non-transmitted coefficients but not the estimate of the direct genetic effect in the trio model. We simulated three NDC trios and three control trios. Each individual has a polygenic score (PGS) and a rare variant burden score (RVBS), representing the measured common and rare variant risk for NDCs, respectively. The child in each trio family has inherited about the expected number of risk alleles (the average of their parents) - the transmitted alleles (T). In these simulated hypothetical families, the child does not show significant deviation from parental average, which is what we observe for PGSEA (Fig. 3). We also show the PGS and RVBS derived from the parental non-transmitted risk alleles (NT). An individual’s PGS is correlated with their RVBS (black double arrows) due to parental assortment which started in previous generations (Extended Data Fig. 2b). However, in these hypothetical families, the child’s PGS deviation from their parental average is not significantly correlated with their RVBS deviation (grey double arrows). In the ‘proband-only model’, θT captures both the association between child’s PGS and NDC risk and the association between child’s RVBS and NDC risk (blue solid arrow) due to the correlation between child’s PGS and RVBS. In the ‘trio model’, the parental non-transmitted coefficients (θm,NT, θf,NT) capture the effects of both the parental PGS and RVBS (purple solid arrows) for the same reason. However, the coefficient on the child’s PGS (the estimate of the direct genetic effect, δ) captures the association of the deviation from parental average PGS due to Mendelian segregation (orange solid arrow), which is uncorrelated with the rare variant effects. Note that the values for PGS and RVBS have been chosen deliberately to emphasize the point for illustrative purposes, but real correlations between the measured scores are much weaker (Fig. 5). We used simulated counts to calculate Pearson correlation coefficients and reported two-sided P values. (B) Effect sizes of PGS and RVBS on case/control status within GEL estimated from the ‘proband-only’ and ‘trio’ models. Two-sided P values and effect sizes (reported in Supplementary Table 10) were estimated from logistic regression models fitted to 1,343 trios in which the proband with a neurodevelopmental condition is undiagnosed and parents are unaffected, and 872 trios without neurodevelopmental conditions. Case/control status was regressed on either the child’s PGS (proband-only model), the child’s PGS and child’s RVBS (proband-only model + RVBS), all three trio members’ PGSs (trio model), or all three trio members’ PGSs and RVBSs (trio model+RVBS). We have indicated results from the latter with a red box, since they are the main focus of this figure. One asterisk indicates nominally significant results (P < 0.05) and a double asterisk indicates significant results that passed Bonferroni correction for five PGSs. Note that the ‘proband-only’ model and ‘trio’ model were also shown in Fig. 4 using additional cases and controls, rather than just GEL. The RVBS was defined as the number of rare damaging PTVs and missense variants in constrained genes (excluding de novo mutations in the child), corrected for 20 genetic principal components.

