
Fig. 2. Disentangling polygenic score associations with diagnostic status.
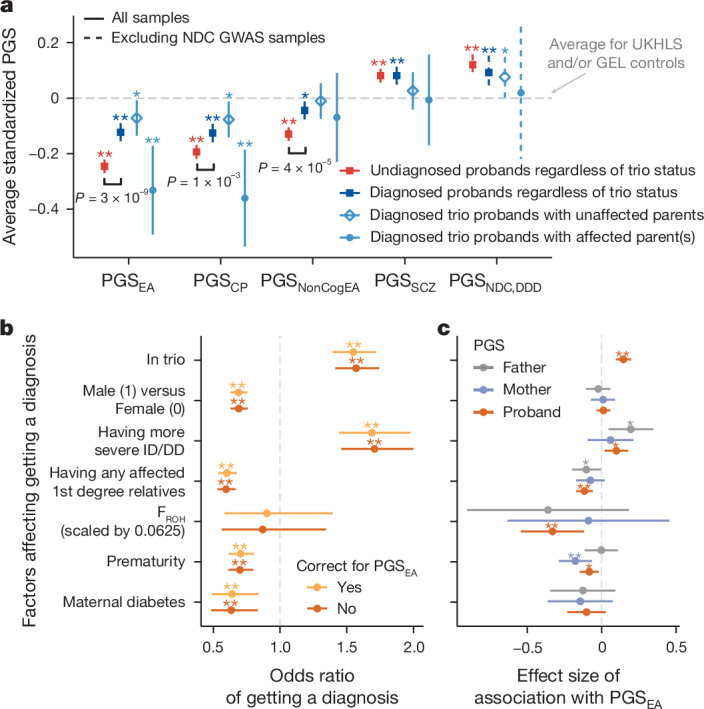
a, Average polygenic scores (PGSs) in probands with (‘diagnosed’; N = 3,821; dark blue) versus without (‘undiagnosed’; N = 6,345; red) a monogenic diagnosis, from DDD and GEL combined. Diagnosed probands from trios split by parental affectedness are in light blue. The scores have been standardized such that the controls have mean 0 and variance 1. Subgroups that have significantly different average polygenic score from controls (dashed line) are indicated by an asterisk (*P < 0.05) or double asterisk (**P < 0.01 after Bonferroni correction for five polygenic scores). Significant differences between diagnosed (dark blue) and undiagnosed (red) patients are annotated with P values. See Supplementary Table 5 for results of two-sided t-tests comparing the various groups. UKHLS, UK Household Longitudinal Study. b, Associations between various factors and diagnostic status within the full DDD cohort1, with or without correcting for the proband’s PGSEA (N = 7,549), calculated within probands of GBR ancestry (individuals with genetic similarity to British individuals from the 1,000 Genomes Project) using logistic regression. An odds ratio (shown in points) greater than one indicates that that factor is associated with a higher chance of receiving a monogenic diagnosis. FROH, the fraction of the genome in runs of homozygosity; ID/DD, intellectual disability or developmental delay. c, Associations between these factors and DDD probands’ (N = 7,549), mothers’ or fathers’ PGSEA (N = 2,497). Points show effect sizes assessed by linear regression. A double asterisk indicates that the association passed Bonferroni correction for seven factors (see Supplementary Table 8 for exact P values). The expected value of FROH is 0.0625 for individuals whose parents are first cousins. P values in all panels are two-sided. Error bars show 95% confidence intervals.