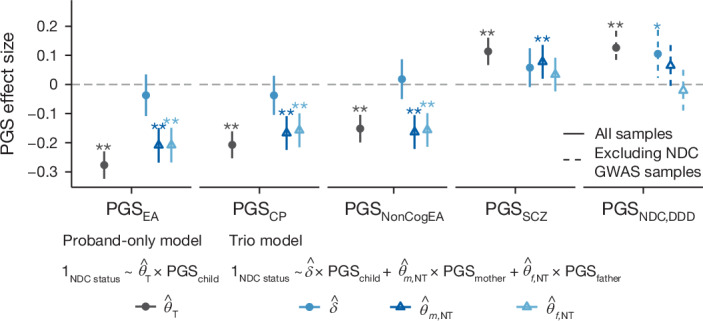
Fig. 4. Assessing direct genetic effects and associations with non-transmitted parental alleles.

The plot shows effect sizes of polygenic scores on case status, testing either the child’s polygenic score alone (proband-only model) among trio probands or while also controlling for the parents’ scores (trio model). Logistic regression models (annotated in the figure) were fitted to compare undiagnosed probands with neurodevelopmental conditions from 2,866 trios from DDD + GEL (or 1,567 trios for testing PGSNDC,DDD) in which parents are unaffected with 4,804 control trios. 1NDC status is an indicator for whether the proband has a neurodevelopmental condition (1) or is a control (0). In the trio model, the coefficients on the parental polygenic scores are referred to as the non-transmitted coefficients ( and ), whereas the coefficient on the child’s score is called the direct effect (). Error bars indicate 95% confidence intervals. One asterisk indicates nominally significant results (*P < 0.05) and double asterisk (**P < 0.01) indicates significant results that passed the Bonferroni correction for five polygenic scores. See Supplementary Table 10 for two-sided P values.
