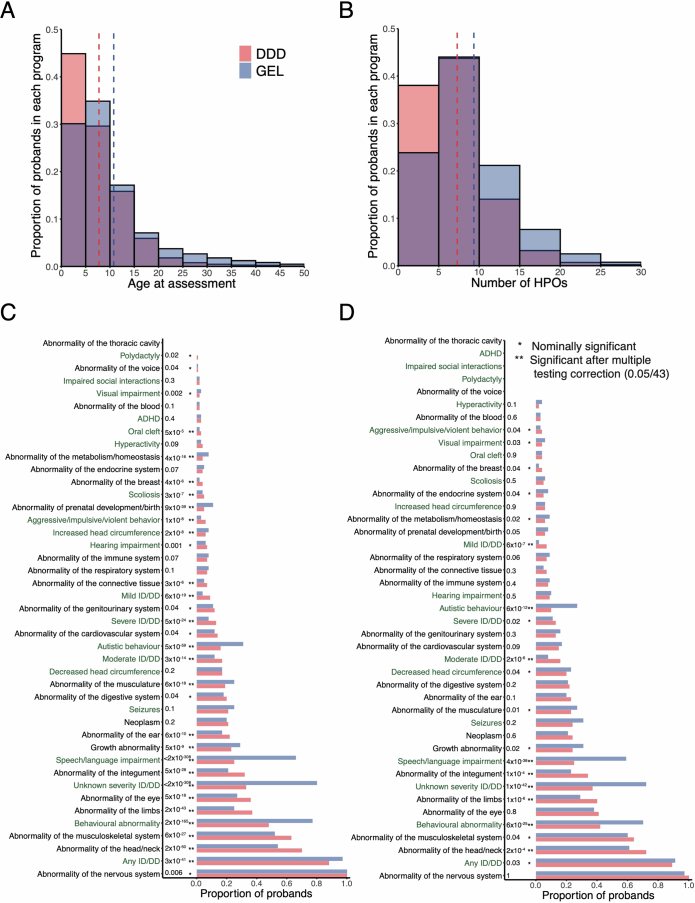
Extended Data Fig. 3. Phenotypic comparisons between DDD and GEL.
Distribution of age at assessment (A) and number of HPO terms (B) in both DDD and GEL probands with neurodevelopmental conditions who have GBR ancestry. The vertical lines indicate the means. A small number of probands in each program were aged over 50 and had more than 30 HPOs, and these have been omitted from the plot due to data sharing restrictions. (C) Proportion of probands from each cohort with at least one HPO term within the indicated chapter (black text) or specific phenotype (green text), ordered by the prevalence in DDD. The asterisks indicate results from a logistic regression testing whether there was a significant difference in phenotype prevalence between cohorts after controlling for sex and age (** indicates two-sided P < 0.05/43; * indicates two-sided P < 0.05; exact P values are annotated beside the asterisks). (D) Proportion of probands recruited to both DDD and GEL (N = 789) with at least one HPO term within the indicated chapter (black) or specific phenotype (green text) from the phenotype information from each program, ordered by the prevalence in DDD. The same logistic regression was used as in (C).

