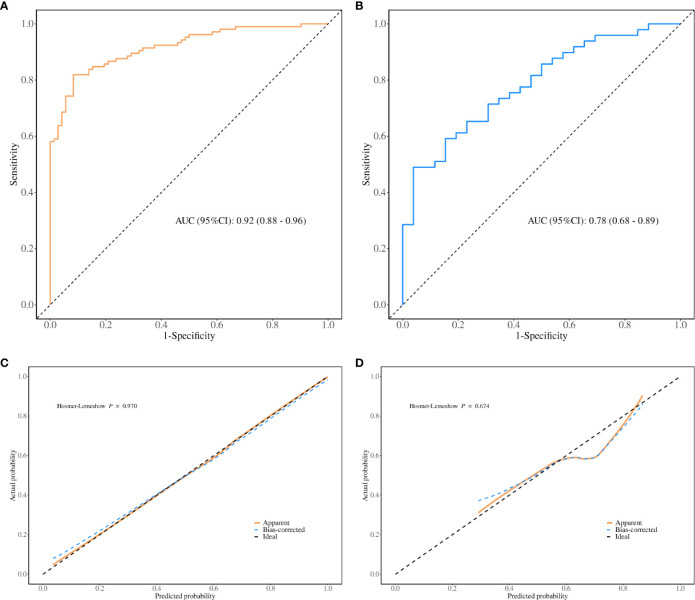
Figure 6.
Goodness of Fit for Predicted and Actual Risks of Multidrug-Resistant and Fungal Infections. Panel (A) displays the ROC curves for the model in the training cohort, while panel (B) presents the ROC curves for the validation cohort. Panel (C) shows the calibration curves for the model in the training cohort, and panel (D) presents the corresponding calibration curves for the validation cohort. The ROC curves highlight the model’s discrimination capability, with a larger AUC indicating higher prediction accuracy. The calibration curves assess the alignment between the predicted risks of multidrug-resistant bacterial and fungal infections and the actual observed outcomes. The 45-degree dotted line represents perfect predictions, while the solid line indicates the model’s predictive performance. A closer fit of the solid line to the dotted line reflects better predictive accuracy.

