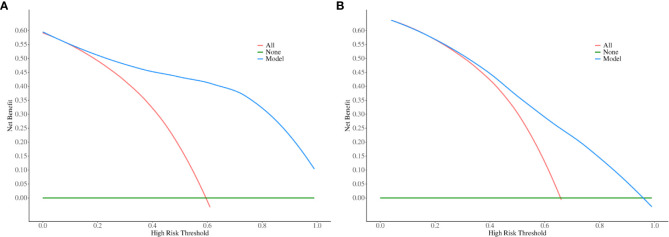
Figure 7.
Decision curve analysis (DCA) for predicting multidrug-resistant bacterial and fungal infections. The x-axis represents the risk threshold probability, ranging from 0 to 1, while the y-axis shows the calculated net benefit associated with each threshold probability. The blue curves illustrate the net benefit of the model, whereas the red lines indicate the net benefits of strategies involving all patients with multidrug-resistant bacterial and fungal infections. In contrast, the green lines reflect the net benefits of strategies where no patients are assumed to have multidrug-resistant bacterial and fungal infections. Panels (A, B) correspond to the training cohort and the validation cohort, respectively.

