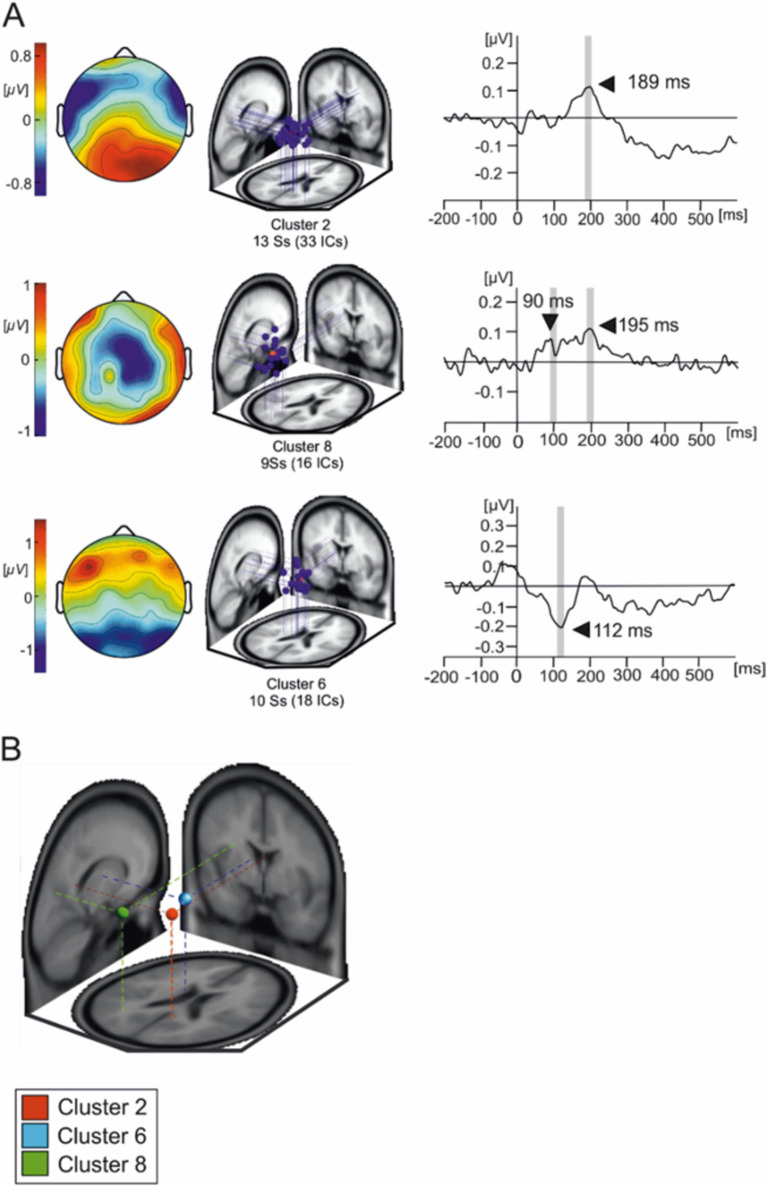
Figure 4.
Independent components composing the three IC clusters of interest. (A) Overlaid scalp plots of each cluster of interest (IC cluster 1, IC cluster 8, and IC cluster 6). Scalp plot polarities presented here are arbitrary. The shaded time interval where statistical testing was performed. (B) Average IC cluster locations and projection lines on a three-slice MRI template (red sphere represents the averaged dipole location for cluster 2, blue sphere represents the averaged dipole location for cluster 6 and green represents the averaged dipole location for cluster 8).

