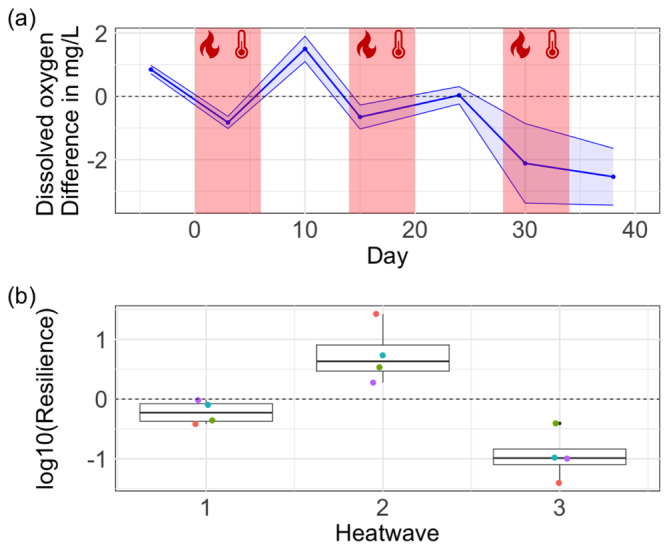
FIGURE 2.

Dissolved oxygen dynamics over time. (a) shows the difference in DO between mesocosm undergoing the HW treatment and the control mesocosms (dashed line at zero). The red areas show the timing of the three heatwaves. (b) Boxplot of resilience of DO after each HW. Coloured dots represent the different mesocosms. Values of resilience > 0 mean increased resilience (HW and control mesocosms became more similar after a HW), whereas values of resilience < 0 mean decreased resilience (HW and control mesocosms became more dissimilar after a HW).
